BATTS
Boosting and Bayesian Additive Trees for Two-Sample Comparison
Implements boosting and Bayesian additive tree methods for
two-sample comparison through density ratio estimation, following
Awaya, Xu, and Ma (2025)
BATTS: Vignette
BATTS implements the boosting and Bayesian additive tree methods from Awaya, Xu, and Ma (2025) for two-sample comparison through density ratio estimation.
Paper: Two-sample comparison through additive tree models for density ratios
Install BATTS
library(devtools)
install_github("nawaya040/BATTS@v0.3.0")
Releases and reproducibility
The official distribution is
nawaya040/BATTS. From version
0.3.0, the defaults of boots() and batts() are the settings used in
the paper’s simulations: gradient boosting with at most 1000 trees
selected by 5-fold CV, depth 4, learning rate 0.01 and per-tree
subsampling of one half; and 200 Bayesian trees with 2000 burn-in
iterations and 1000 saved draws. Calls that relied on earlier defaults
give different results; see NEWS.md. The paper’s simulations
used version 0.2.2 (tag v0.2.2) with all settings supplied explicitly.
Versions 0.2.2 and 0.3.0 implement the same algorithms: 0.3.0 changes
only default argument values, and a fit with the same explicit arguments
and seed gives identical results in both versions.
For paper reproduction, use the exact BATTS commit recorded in the chosen simulation repository checkout. From that checkout’s root, the supported environment bootstrap is:
Rscript scripts/prepare_environment.R --install=true --r-lib=.Rlib
For a package-only installation using the same pin, run from that simulation checkout’s root in a fresh R session:
source("config/study.R")
batts_sha <- study_config("smoke")$batts_sha
stopifnot(grepl("^[0-9a-f]{40}$", batts_sha))
remotes::install_github(paste0("nawaya040/BATTS@", batts_sha), upgrade = "never")
The smoke and paper profiles use the same dependency commit. Record the
simulation commit as well; selecting a moving branch does not freeze it.
Building from source requires a C++17 toolchain (Rtools on Windows).
Version 0.2.0 removed update_lambda, lambda_prior_parameters, and
alpha_cutpoint; remove these named arguments from older calls. See
NEWS.md for numerical changes in earlier versions. Package
commit, dependency versions, settings and seeds should accompany each
run.
This repository contains the estimator package, documentation, small examples and regression tests. Paper-scale simulations, comparator configurations, case-study data and reproduction workflows are maintained separately. The worked example below is an API demonstration with its own settings. It does not reproduce a specific paper table or establish MCMC convergence.
The example uses a shorter MCMC run than the defaults (2000 burn-in
iterations and 1000 draws) to finish quickly. Use
output_BART_ensembles = TRUE when posterior prediction at new points
is needed. Prediction outside the fitted domain is rejected. All
returned weights are sqrt(p/q); use 2 * log(w) for the full
log-density ratio. Check mixing across chains and sensitivity to limited
overlap before interpreting posterior intervals. Nominal pointwise
intervals do not provide a guarantee of frequentist coverage or
simultaneous inference.
Main functions
From version 0.4.0 the main user-facing functions are:
batts_boost()fits the boosting estimator, with settings collected inboost_control().batts_bart()fits the Bayesian additive tree model, with settings inbart_control(), and returns posterior draws for uncertainty quantification.predict(),fitted()anddensity_ratio()evaluate a fit;print(),summary()andplot()describe it.
The fitting functions accept a matrix, a data frame or a vector, group labels
of any two-valued type, or two samples (batts_boost(x, y = y)).
boots(), batts() and eval_balance_weight(), the interface of versions
0.1.0 to 0.3.0, still work and give the same results, but are deprecated.
They return the square root of the density ratio, so the worked example
below, written for that interface, converts outputs to log-density ratios
for plotting and interpretation.
Worked example
The full example script is included in example.R. The
code below reproduces the main workflow.
library(mvtnorm)
library(ggplot2)
library(BATTS)

balance_to_log_ratio = function(x) {
  log(x) * 2
}

calc_quantiles = function(x) {
  quantile(x, probs = c(0.025, 0.975))
}
Generate a two-sample data set
set.seed(1)

n0 = 1000
n1 = 1000

X0 = rmvnorm(n0, mean = c(-0.5, -0.5))
X1 = rmvnorm(n1, mean = c(0.5, 0.5))

data = rbind(X0, X1)
group_labels = c(rep(0, n0), rep(1, n1))
Boosting fit
result_boosting = boots(
  data = data,
  group_labels = group_labels,
  num_trees_max = 1000,
  K_CV = 5,
  max_resol = 4,
  learn_rate = 0.01,
  n_bins = 32,
  margin_scale = 0.1,
  use_gradient = TRUE,
  subsample_fraction = 0.5,
  quiet = TRUE
)

log_ratio_boosting =
  balance_to_log_ratio(result_boosting$balance_weight_boosting_data)
Bayesian additive tree fit
result_BAT = batts(
  data = data,
  group_labels = group_labels,
  num_trees = 200,
  lambda_0 = 5,
  margin_scale = 0.1,
  size_burnin = 500,     # default 2000; shortened for the demonstration
  size_backfitting = 500,  # default 1000
  output_BART_ensembles = TRUE,
  quiet = TRUE
)

log_ratio_BAT = balance_to_log_ratio(result_BAT$balance_weight_BART_data)
log_ratio_BAT_mean = rowMeans(log_ratio_BAT)
log_ratio_BAT_quantiles = apply(log_ratio_BAT, 1, calc_quantiles)
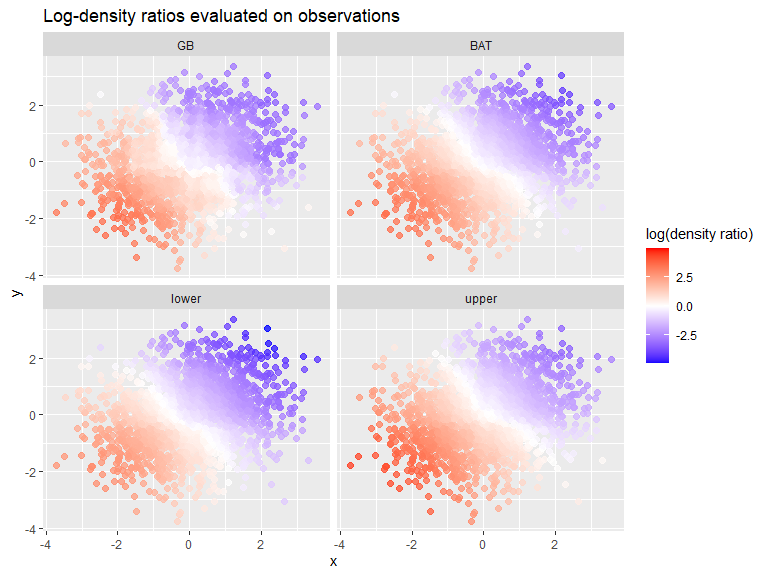
Plot fitted log-density ratios on the observed data
methods = c("GB", "BAT", "lower", "upper")

ratio_df = data.frame(
  x = rep(data[, 1], 4),
  y = rep(data[, 2], 4),
  log_ratio = c(
    log_ratio_boosting,
    log_ratio_BAT_mean,
    log_ratio_BAT_quantiles[1, ],
    log_ratio_BAT_quantiles[2, ]
  ),
  method = factor(rep(methods, each = nrow(data)), levels = methods)
)

max_abs = max(abs(ratio_df$log_ratio))

ggplot(ratio_df, aes(x = x, y = y, color = log_ratio)) +
  geom_point(size = 2, alpha = 0.75) +
  scale_color_gradientn(
    colours = c("blue", "white", "red"),
    values = scales::rescale(c(-max_abs, 0, max_abs)),
    limits = c(-max_abs, max_abs),
    oob = scales::squish
  ) +
  facet_wrap(~method, nrow = 2) +
  labs(color = "log(density ratio)") +
  ggtitle("Log-density ratios evaluated on observations")
Evaluate on new points
eval_points = rmvnorm(1000, mean = c(0, 0), sigma = diag(2))

eval_boosting = eval_balance_weight(
  list_result = result_boosting,
  eval_points = eval_points,
  is_Bayes = FALSE
)

log_ratio_eval_boosting =
  balance_to_log_ratio(eval_boosting$balancing_weight_boosting)

eval_BAT = eval_balance_weight(
  list_result = result_BAT,
  eval_points = eval_points,
  is_Bayes = TRUE
)

log_ratio_eval_BAT = balance_to_log_ratio(eval_BAT$balancing_weight_BART)
log_ratio_eval_BAT_mean = rowMeans(log_ratio_eval_BAT)
log_ratio_eval_BAT_quantiles = apply(log_ratio_eval_BAT, 1, calc_quantiles)
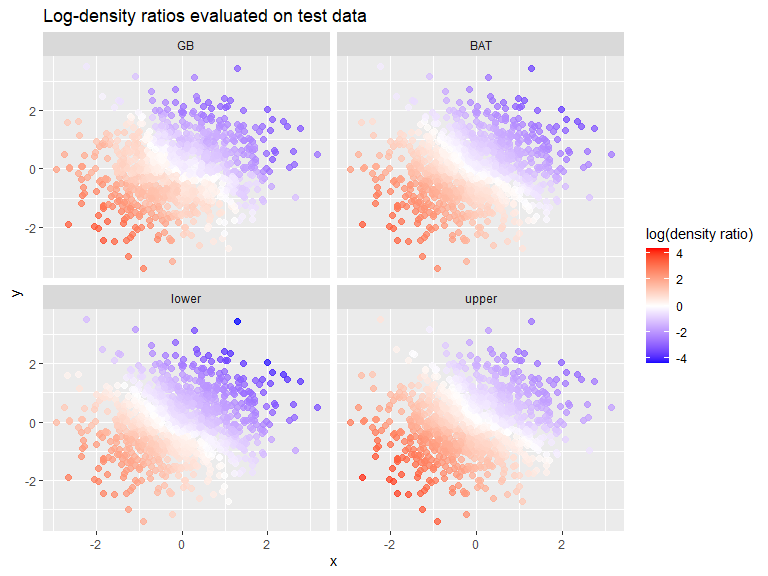
Plot evaluated log-density ratios on new points
methods = c("GB", "BAT", "lower", "upper")

ratio_eval_df = data.frame(
  x = rep(eval_points[, 1], 4),
  y = rep(eval_points[, 2], 4),
  log_ratio = c(
    log_ratio_eval_boosting,
    log_ratio_eval_BAT_mean,
    log_ratio_eval_BAT_quantiles[1, ],
    log_ratio_eval_BAT_quantiles[2, ]
  ),
  method = factor(rep(methods, each = nrow(eval_points)), levels = methods)
)

max_abs = max(abs(ratio_eval_df$log_ratio))

ggplot(ratio_eval_df, aes(x = x, y = y, color = log_ratio)) +
  geom_point(size = 2, alpha = 0.75) +
  scale_color_gradientn(
    colours = c("blue", "white", "red"),
    values = scales::rescale(c(-max_abs, 0, max_abs)),
    limits = c(-max_abs, max_abs),
    oob = scales::squish
  ) +
  facet_wrap(~method, nrow = 2) +
  labs(color = "log(density ratio)") +
  ggtitle("Log-density ratios evaluated on test data")
Reference
Awaya, N., Xu, Y., and Ma, L. (2025). Two-sample comparison through additive tree models for density ratios.