MFO
Maximal Fat Oxidation and Kinetics Calculation
Computes the maximal fat oxidation (MFO), the exercise intensity
that elicits it (Fatmax), the Fatmax zone and the crossover point from
indirect calorimetry data of a graded exercise test. Substrate oxidation is
estimated with the stoichiometric equations of Frayn (1983)
MFO


MFO computes, from indirect-calorimetry data, the maximal fat oxidation rate (MFO), the exercise intensity at which it occurs (Fatmax), the Fatmax zone, the crossover point, and the SIN model of fat oxidation kinetics (Chenevière et al., 2009). It is aimed at sport and health scientists who run graded exercise tests and want a reproducible, documented alternative to hand-made spreadsheets.
Installation
The development version (0.2.x, recommended) is installed from GitHub:
# install.packages("pak")
pak::pak("JorgeDelro/MFO")
The CRAN release is still 0.1.0 (2022) and lacks most of the features described below:
install.packages("MFO")
What you need
One participant is described by three recordings, exported from the gas
analyser at a fixed sampling interval (step_time, in seconds) with
columns VO2 and VCO2 (mL/min), RER and HR (bpm):
| Recording | Argument | Used for |
|---|---|---|
| Resting metabolism (15–30 min) | db_basal |
Most stable 5-min window → resting VO2, RER, CHO, FAT, kcal |
| Incremental MFO test | db_MFO |
Steady-state average of each step → fat oxidation curve |
| Maximal graded test | db_graded |
VO2max = highest mean over vo2max_window s (default 30), to express intensity as %VO2max (or pass VO2max directly) |
The package ships one anonymised example participant (basal_df,
MFO_df, VO2max_df).
Example
library(MFO)

data(list = c("basal_df", "MFO_df", "VO2max_df"), package = "MFO")

result <- MFO(
  step_time = 20,             # one record every 20 s
  db_MFO = MFO_df,
  db_basal = basal_df,
  db_graded = VO2max_df,
  cv_var = "RER",             # stability criterion for the resting window
  author = "Frayn",           # stoichiometric equations
  method = "P3",              # curve-fitting method
  step_duration = 180,        # 3-min steps
  steady_state_duration = 60, # average the last minute of each step
  body_mass = 75,
  HRmax = 190
)
#> Warning in MFO(step_time = 20, db_MFO = MFO_df, db_basal = basal_df, db_graded
#> = VO2max_df, : 1 step(s) with negative fat oxidation detected (RER > 1.0
#> artifact).

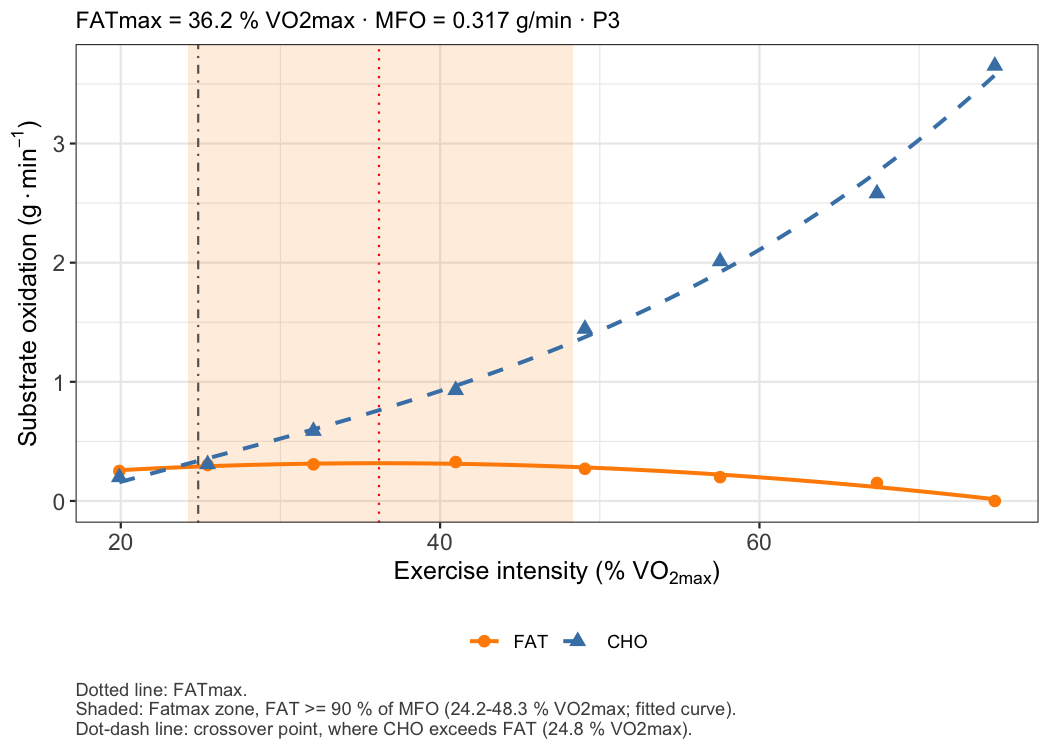
result$MFO       # g/min
#> [1] 0.316712
result$FAT_MAX   # %VO2max
#> [1] 36.17038
result$VO2max    # ml/min, highest 40-s mean (30 s rounded up to 2 records)
#> [1] 3315
c(result$FatMax_zone_lower, result$FatMax_zone_upper)
#> [1] 24.19065 48.34069
result$MFO_plot
The kinetics of the curve are described with the SIN model:
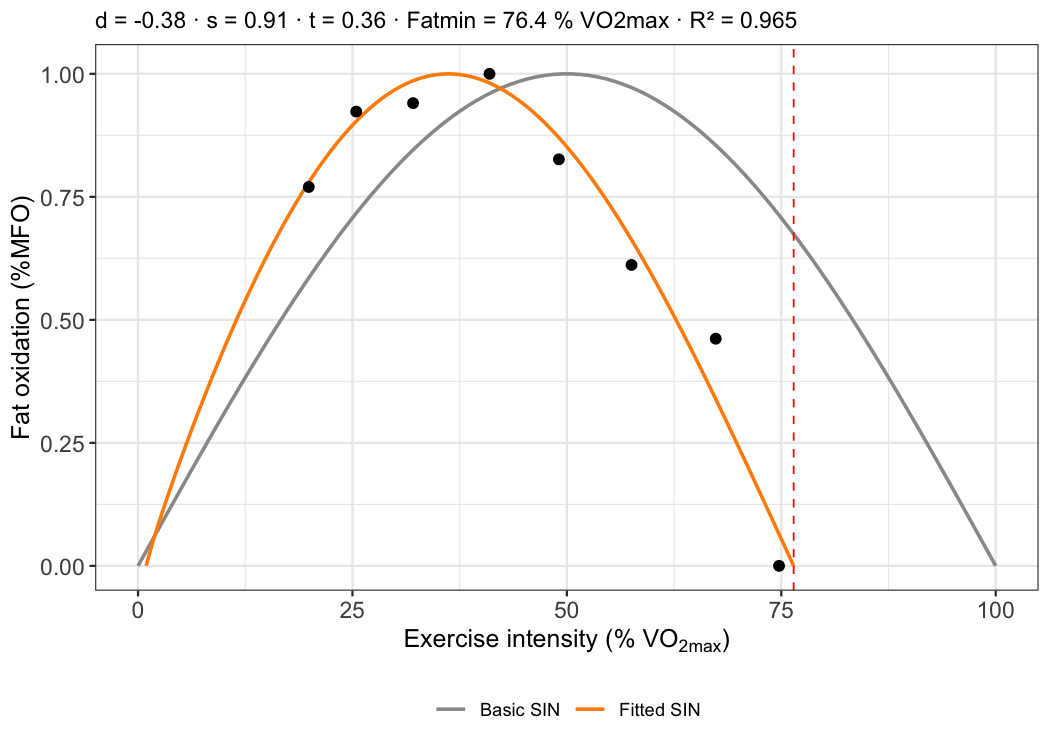
kin <- MFO_kinetics(result$MFO_db)
unlist(kin[c("d", "s", "t", "FatMax_SIN", "Fatmin", "R_squared")])
#>          d          s          t FatMax_SIN     Fatmin  R_squared
#> -0.3848798  0.9096423  0.3551958 36.1821171 76.4426627  0.9654434
kin$MFO_kinetics_plot
To process a whole folder of participants and write a summary table, see
?MFOs.
Methods
Substrate oxidation
Fat (FAT) and carbohydrate (CHO) oxidation in g/min are computed from
VO2 and VCO2 in L/min, assuming negligible protein oxidation during
exercise. Choose the equation set with author:
author |
CHO (g/min) | FAT (g/min) | Source |
|---|---|---|---|
"Frayn" |
4.55 VCO2 − 3.21 VO2 | 1.67 VO2 − 1.67 VCO2 | Frayn (1983) |
"Peronnet" |
4.58519 VCO2 − 3.22597 VO2 | 1.69469 VO2 − 1.70130 VCO2 | Péronnet & Massicotte (1991), derived from Table 1 |
"Jeukendrup" |
4.344 VCO2 − 3.061 VO2 (40–50 %VO2max) 4.210 VCO2 − 2.962 VO2 (50–75 %VO2max) |
1.695 VO2 − 1.701 VCO2 | Jeukendrup & Wallis (2005) |
"Jeukendrup" needs VO2max to pick the CHO equation for each step.
Energy expenditure (Kcal) is CHO × 4 + FAT × 9 kcal/min with
energy_equivalents = "classic", the default in 0.2.x; "source" uses
the values of each equation’s source (Péronnet & Massicotte
3.8683/9.7460 kcal/g, also for Frayn, who gives none; Jeukendrup &
Wallis 3.95 or 4.07/9.75 kcal/g). The default will change to "source"
in 0.3.0. Always report which equation you used: differences are small
for FAT but grow for CHO and the crossover point.
Locating MFO and Fatmax
Each step contributes one point (FAT, %VO2max). method chooses how the
maximum is located:
"P3"(default): third-degree polynomial $\mathrm{FAT}(x) = a + bx + cx^2 + dx^3$, with $x$ = %VO2max. Fatmax is the root of $b + 2cx + 3dx^2 = 0$ that lies within the measured range and gives the highest FAT. Falls back to P2 with a warning if the cubic cannot be fitted."P2": parabola, Fatmax $= -b / 2c$. More stable with few steps, but forces a symmetric curve."MV"(measured values): the step with the highest observed FAT (authorequations). No curve is fitted:R_squaredandRMSEareNAand the Fatmax zone uses linear interpolation between steps."MRER"(Chenevière et al., 2009): $1 - \mathrm{RER} = a_1 + b_1x$ and $\mathrm{VO_2} = a_2 + b_2x$ are fitted as straight lines, so $\mathrm{FAT} = 1.7,(1 - \mathrm{RER}),\mathrm{VO_2}$ is a parabola with Fatmax at its vertex, $x = -(a_1b_2 + a_2b_1)/(2b_1b_2)$. Falls back to MV with a warning if the vertex is not a maximum inside the measured range. Up to v0.2.0"MRER"returned the highest observed step, which is now"MV".
For P3, P2 and MRER the fit’s R_squared and RMSE are returned. The
Fatmax zone is the range of intensities where the fitted FAT is ≥ 90
% of MFO (Achten et al., 2002). The crossover point is the intensity
at which CHO exceeds FAT, by linear interpolation between steps.
SIN model
MFO_kinetics() normalises fat oxidation to %MFO (highest observed step
= 100 %) and fits the three-parameter sine model of Chenevière et
al. (2009, eq. 14) directly to the observed steps by non-linear least
squares (minpack.lm::nlsLM), with no prior smoothing:
$$ %\mathrm{MFO}(x) = \sin\left{\left[\frac{\pi^{1/s}}{\pi + 2d}\left(Kx + d + t\right)\right]^{s}\right}, \qquad K = \frac{\pi}{100} $$
- d (dilatation): d > 0 widens the curve, d < 0 narrows it.
- s (symmetry): s > 1 shifts the peak to the right with a steeper fall; s < 1 the opposite.
- t (translation): t > 0 shifts the whole curve to the left.
With d = 0, s = 1 and t = 0 the curve is a half sine wave peaking at 50 %VO2max.
Fatmax and Fatmin follow in closed form from the equation: Fatmax =
[(π + 2d)·2^(−1/s) − d − t]/K and Fatmin, the second zero of the
curve, = (π + d − t)/K (fatmin_threshold gives a threshold instead,
e.g. 0.05 of MFO). Chenevière et al. fitted only exercise steps with RER
≤ 1.0: RER_cutoff = 1 reproduces that selection, and
include_basal = TRUE departs from it. The SIN is sensitive to how the
last step is handled (negative_FAT); see ?MFO_kinetics.
Test termination and artefacts
At high intensity, lactate buffering pushes RER above 1 and the equations return negative FAT. Two arguments control this:
RER_cutoff: steps with RER above this value are removed before fitting. A number, or by name following Amaro-Gahete et al. (2019):"classic"(1.00),"safe"(0.95, the end-of-test RER they recommend),"sedentary"(0.93) or"trained"(0.90), the mean RER at MFO in those groups. In the example data they leave 7, 6, 5 and 4 of the 8 steps.negative_FAT:"truncate"negative values to 0 (default),"exclude"those steps, or"keep"them (inspection only).
Outputs
| Element | Unit | Meaning |
|---|---|---|
MFO |
g/min | Maximal fat oxidation |
MFO_relative |
mg/kg/min | MFO / body mass (if body_mass given) |
MFO_FFM |
mg/kgFFM/min | MFO / fat-free mass (if fat_free_mass given) |
FAT_MAX |
%VO2max | Intensity eliciting MFO |
FAT_MAX_HR |
bpm | Heart rate at Fatmax (linear interpolation) |
FAT_MAX_porcHRmax |
%HRmax | Fatmax as %HRmax (if HRmax given) |
FatMax_zone_lower, FatMax_zone_upper |
%VO2max | Fatmax zone |
crossover_point |
%VO2max | Intensity where CHO > FAT |
R_squared, RMSE |
– | Goodness of fit |
x_CHO, x_FAT, x_Kcal |
g/min, kcal/min | Resting values |
MFO_db, MFO_plot |
– | Step table and ggplot |
Known issues in v0.2.x
These were found while verifying the code against the primary sources
(see docs/SPEC.md, section 19) and are scheduled for v0.2.1. The SIN
and MRER issues do not affect MFO and Fatmax obtained with P3 or P2.
- SIN parameters from v0.2.0 and earlier are not comparable with
Chenevière et al. or with the development version: the old code
computed $(\pi^{1/s}/\pi) + 2d$ instead of $\pi^{1/s}/(\pi + 2d)$,
fitted a P3-smoothed grid and used a 5 % threshold for
Fatmin. Fixed in the development version. method = "MRER"in v0.2.0 took the observed maximum of 1.7 (1 − RER) VO2, a measured-values method. The development version implements the two-regression MRER of Chenevière et al. (2009) and addsmethod = "MV".- The resting row is not used in the curve fit unless
include_basal = TRUE(development version). - The
Loadcolumn ofMFO_dbis a step label, not the measured external load.
References
- Achten J, Gleeson M, Jeukendrup AE (2002). Determination of the exercise intensity that elicits maximal fat oxidation. Med Sci Sports Exerc 34:92–97. https://doi.org/10.1097/00005768-200201000-00015
- Amaro-Gahete FJ, et al. (2019). Optimizing maximal fat oxidation assessment by a treadmill-based graded exercise protocol: when should the test end? Front Physiol 10:909. https://doi.org/10.3389/fphys.2019.00909
- Chenevière X, Malatesta D, Peters EM, Borrani F (2009). A mathematical model to describe fat oxidation kinetics during graded exercise. Med Sci Sports Exerc 41:1615–1625. https://doi.org/10.1249/MSS.0b013e31819e2f91
- Frayn KN (1983). Calculation of substrate oxidation rates in vivo from gaseous exchange. J Appl Physiol 55:628–634.
- Jeukendrup AE, Wallis GA (2005). Measurement of substrate oxidation during exercise by means of gas exchange measurements. Int J Sports Med 26 Suppl 1:S28–S37.
- Montes-de-Oca-García A, Perez-Bey A, Corral-Pérez J, et al. (2021). Maximal fat oxidation capacity is associated with cardiometabolic risk factors in healthy young adults. Eur J Sport Sci 21:907–917. https://doi.org/10.1080/17461391.2020.1788650
- Péronnet F, Massicotte D (1991). Table of nonprotein respiratory quotient: an update. Can J Sport Sci 16:23–29.