ggindex
Numbered Focus Points for 'ggplot2' Plots
A 'ggplot2' geom that highlights selected observations of a plot, such as points of a scatter plot, events on a line chart or features on a map, with numbered markers and lists their descriptions in a legend keyed by the same numbers, as on an annotated map.
ggindex 



ggindex marks selected points of a ggplot2 plot with numbered markers
and explains the numbers in a legend, as on an annotated map.
Installation
Install the released version of ggindex from CRAN with:
install.packages("ggindex")
You can install the development version of ggindex from
GitHub with:
# install.packages("pak")
pak::pak("discindo/ggindex")
Example
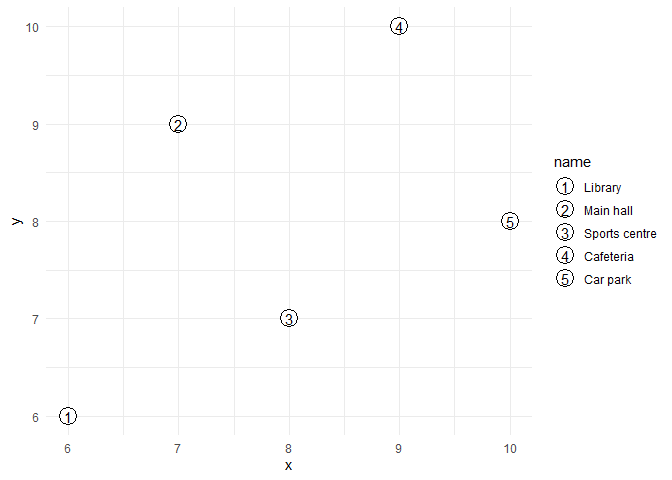
Map info to the description that goes in the legend. The entries are
numbered in the order they appear in the data; map label to choose the
numbers yourself.
library(ggplot2)
#> Warning: package 'ggplot2' was built under R version 4.5.3
library(ggindex)

sites <- data.frame(
  x = c(6, 7, 8, 9, 10),
  y = c(6, 9, 7, 10, 8),
  name = c("Library", "Main hall", "Sports centre", "Cafeteria", "Car park")
)

ggplot(sites, aes(x, y, info = name)) +
  geom_focus() +
  theme_minimal()
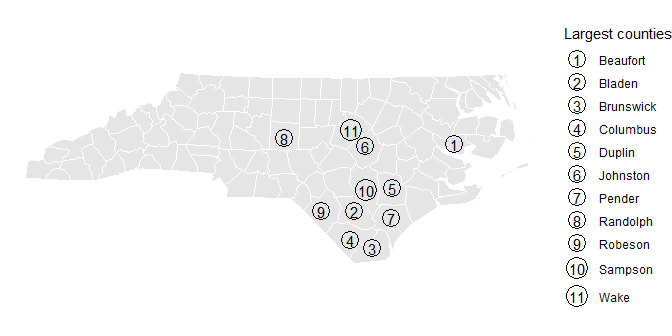
geom_sf_focus() does the same on maps made with the sf package:
nc <- sf::st_read(system.file("shape/nc.shp", package = "sf"), quiet = TRUE)
nc <- sf::st_transform(nc, 32119)
nc_large <- nc[nc$AREA > 0.2, ]

ggplot(nc) +
  geom_sf(fill = "grey90", colour = "white") +
  geom_sf_focus(aes(info = NAME), data = nc_large) +
  scale_info_discrete("Largest counties") +
  theme_void()
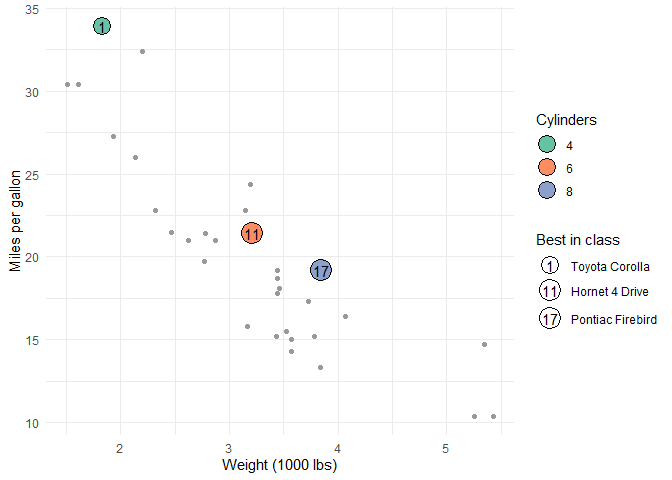
Map focus to number only some observations, and draw the rest with
geom_point(). The markers take the standard colour, fill, shape
and size aesthetics, so regular ggplot2 scales apply. Here the most
efficient car of each cylinder class is numbered by its overall rank and
filled by class:
cars <- mtcars
cars$model <- rownames(cars)
cars$rank <- rank(-cars$mpg, ties.method = "first")
cars$best <- cars$mpg == ave(cars$mpg, cars$cyl, FUN = max)

ggplot(cars, aes(wt, mpg)) +
  geom_point(colour = "grey60") +
  geom_focus(aes(label = rank, focus = best, info = model, fill = factor(cyl))) +
  scale_fill_brewer("Cylinders", palette = "Set2") +
  scale_info_discrete("Best in class") +
  labs(x = "Weight (1000 lbs)", y = "Miles per gallon") +
  theme_minimal()
Map label, focus and info in geom_focus() when the plot has
other layers: layers inherit the mapping of ggplot(), and their
observations would also appear in the legend.