ggrecipes
Recipes for Data Visualization
A collection of custom 'ggplot2'-based visualizations for data exploration and analysis. Each function handles data preprocessing and returns a object that can be further customized using standard 'ggplot2' syntax.
ggrecipes 


A collection of easy-to-use custom ggplot2-based functions for data exploration and analysis. Each function handles data preprocessing and returns a ggplot2 object that can be further customized using standard ggplot2 syntax. Includes general-purpose and domain-specific visualizations.
Features
General:
General-purpose visualizations
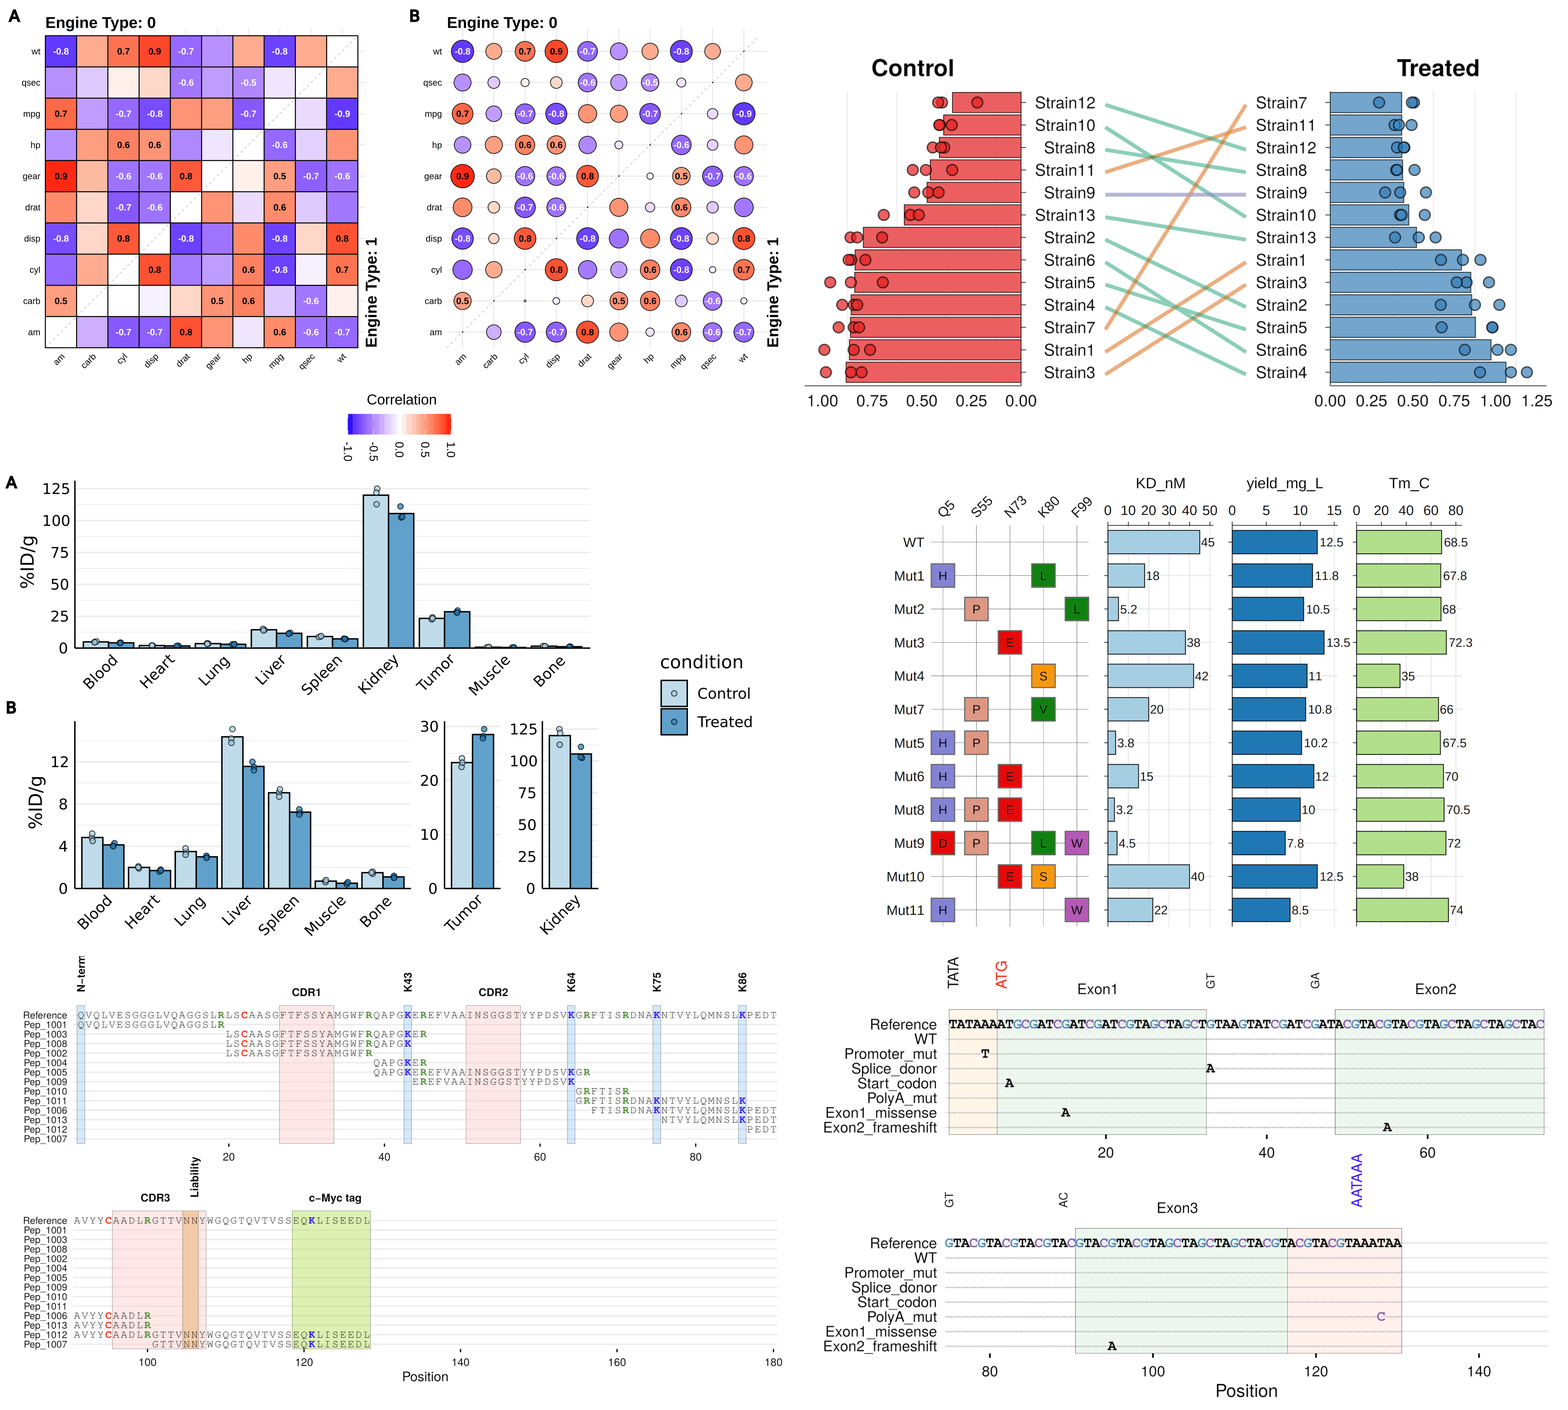
gg_splitcorr()- Split-Correlation Heatmapgg_rankshift()- Paired box-/bar- plots with rank changegg_criteria()- Criteria heatmap with optional barplotsgg_conf()- Confusion/contingency table bubble plot
Bioinformatics:
Sequence analysis and genomics visualizations
gg_geno()- Biallelic genotype visualization with split tiles and optional barplotsgg_seq()- Sequence coverage plot with region highlightinggg_seqdiff()- Sequence alignment showing only differencesgg_biodist()- Biodistribution plots with easy free-scale faceting
Chemoinformatics:
Binding kinetics and drug discovery visualizations
gg_kdmap()- Kinetic rate maps (association/dissociation) with iso-affinity lines
Installation
Install from CRAN:
# currently unavailable - initial submission in progress
install.packages("ggrecipes")
Development version from GitHub:
# install.packages("devtools")
devtools::install_github("Ignophi/ggrecipes")
Documentation
Citation
If you use ggrecipes in your work, please cite:
[Citation information will be added upon publication]
License
MIT License - see LICENSE file for details.