lineagefreq
Lineage Frequency Dynamics from Genomic Surveillance Counts
Models pathogen lineage frequency dynamics from genomic
surveillance count data. Provides a unified interface for
multinomial logistic regression, hierarchical partial-pooling
models, and the Piantham approximation for relative reproduction
number estimation. Features include rolling-origin backtesting,
standardized forecast scoring, lineage collapsing, emergence
detection, and sequencing power analysis. Designed for real-time
public health surveillance of any variant-resolved pathogen.
Methods described in Abousamra, Figgins, and Bedford (2024)
lineagefreq
Lineage Frequency Dynamics and Growth-Advantage Estimation from Genomic Surveillance Counts




An R package for modeling pathogen lineage frequencies, estimating growth advantages, and forecasting variant replacement dynamics from genomic surveillance counts.
Why lineagefreq?
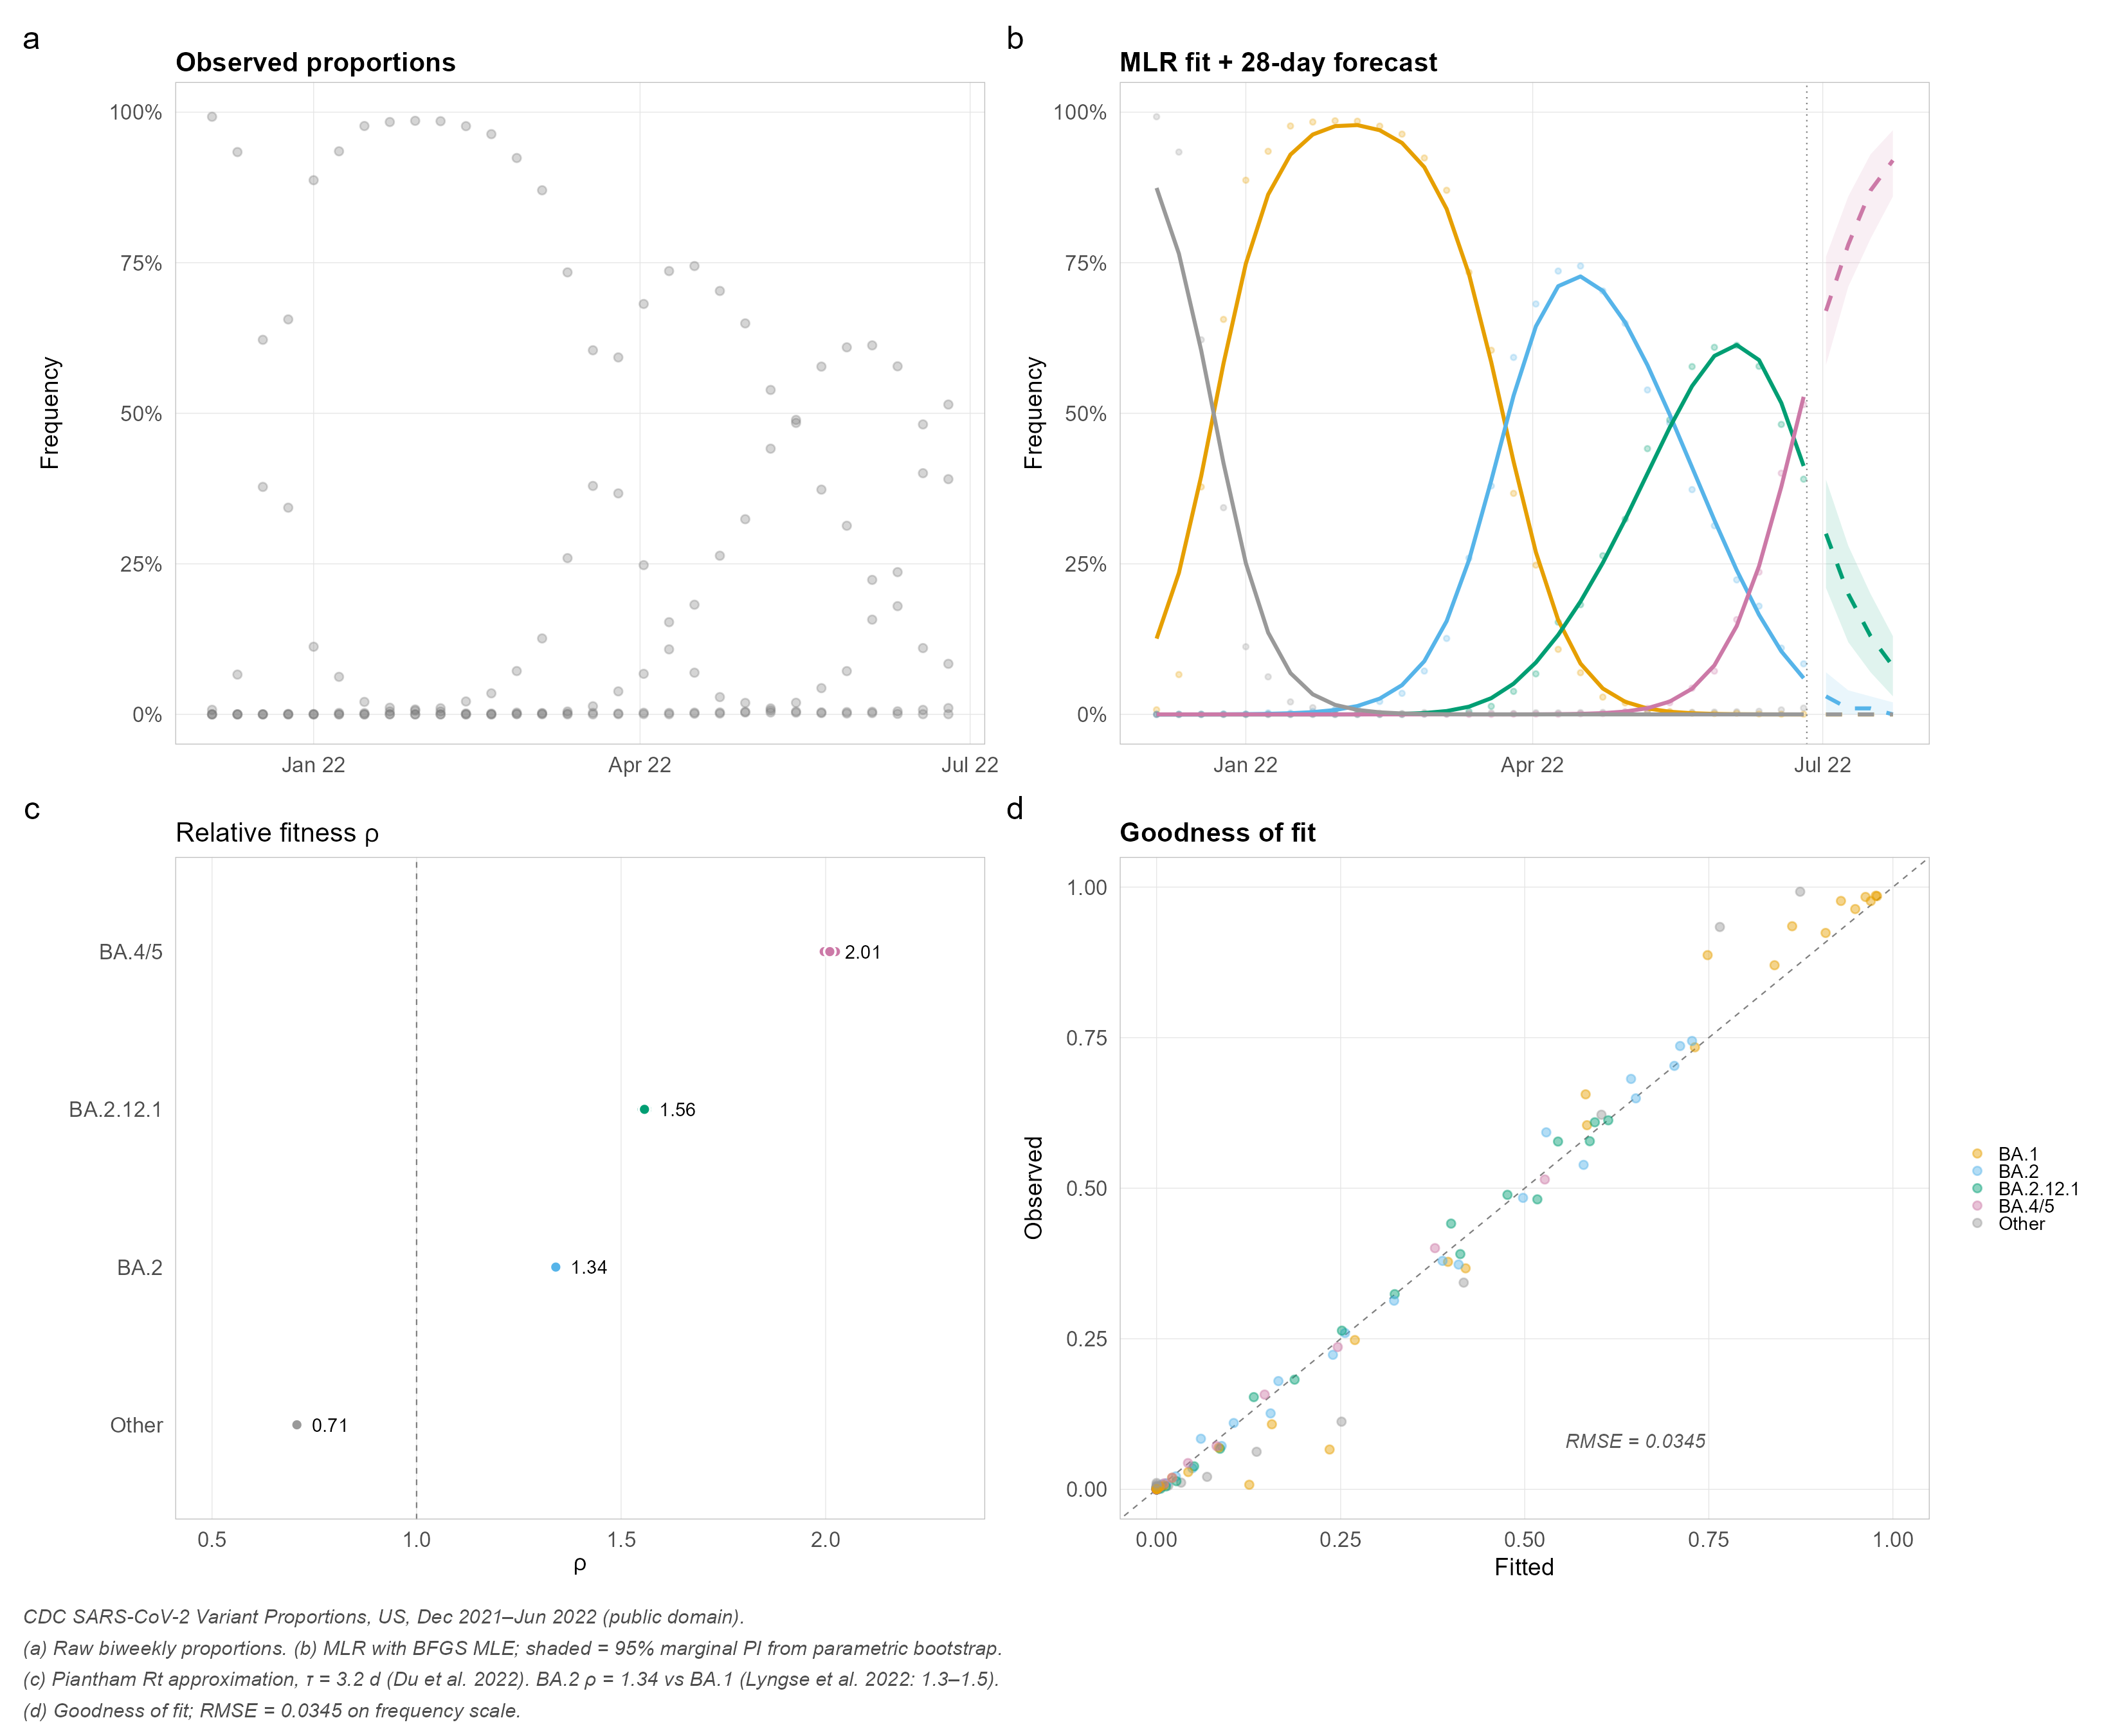
Three lines of code transform raw surveillance counts into publication-ready model fits, growth advantage estimates, and probabilistic forecasts — with built-in backtesting for honest accuracy evaluation.
| Without lineagefreq | With lineagefreq |
|---|---|
| Raw point estimates, no model | MLR / hierarchical MLR / Piantham engines |
| No uncertainty quantification | 95% prediction intervals (parameter + sampling) |
| No forecasting | Probabilistic 2–6 week frequency forecasts |
| No evaluation framework | Rolling-origin backtest + MAE/WIS/coverage |
| Ad hoc scripts per analysis | Reproducible lfq_data → fit_model → forecast pipeline |
| Not on CRAN | CRAN-distributable, tested on 4 platforms |
Installation
# install.packages("pak")
pak::pak("CuiweiG/lineagefreq")

# Or with devtools:
# devtools::install_github("CuiweiG/lineagefreq")
Quick example
library(lineagefreq)
library(ggplot2)

data(cdc_sarscov2_jn1)
x <- lfq_data(cdc_sarscov2_jn1,
              lineage = lineage, date = date, count = count)

fit <- fit_model(x, engine = "mlr")
growth_advantage(fit, type = "relative_Rt", generation_time = 5)

fc <- forecast(fit, horizon = 28)
autoplot(fc)
Real-Data Case Studies
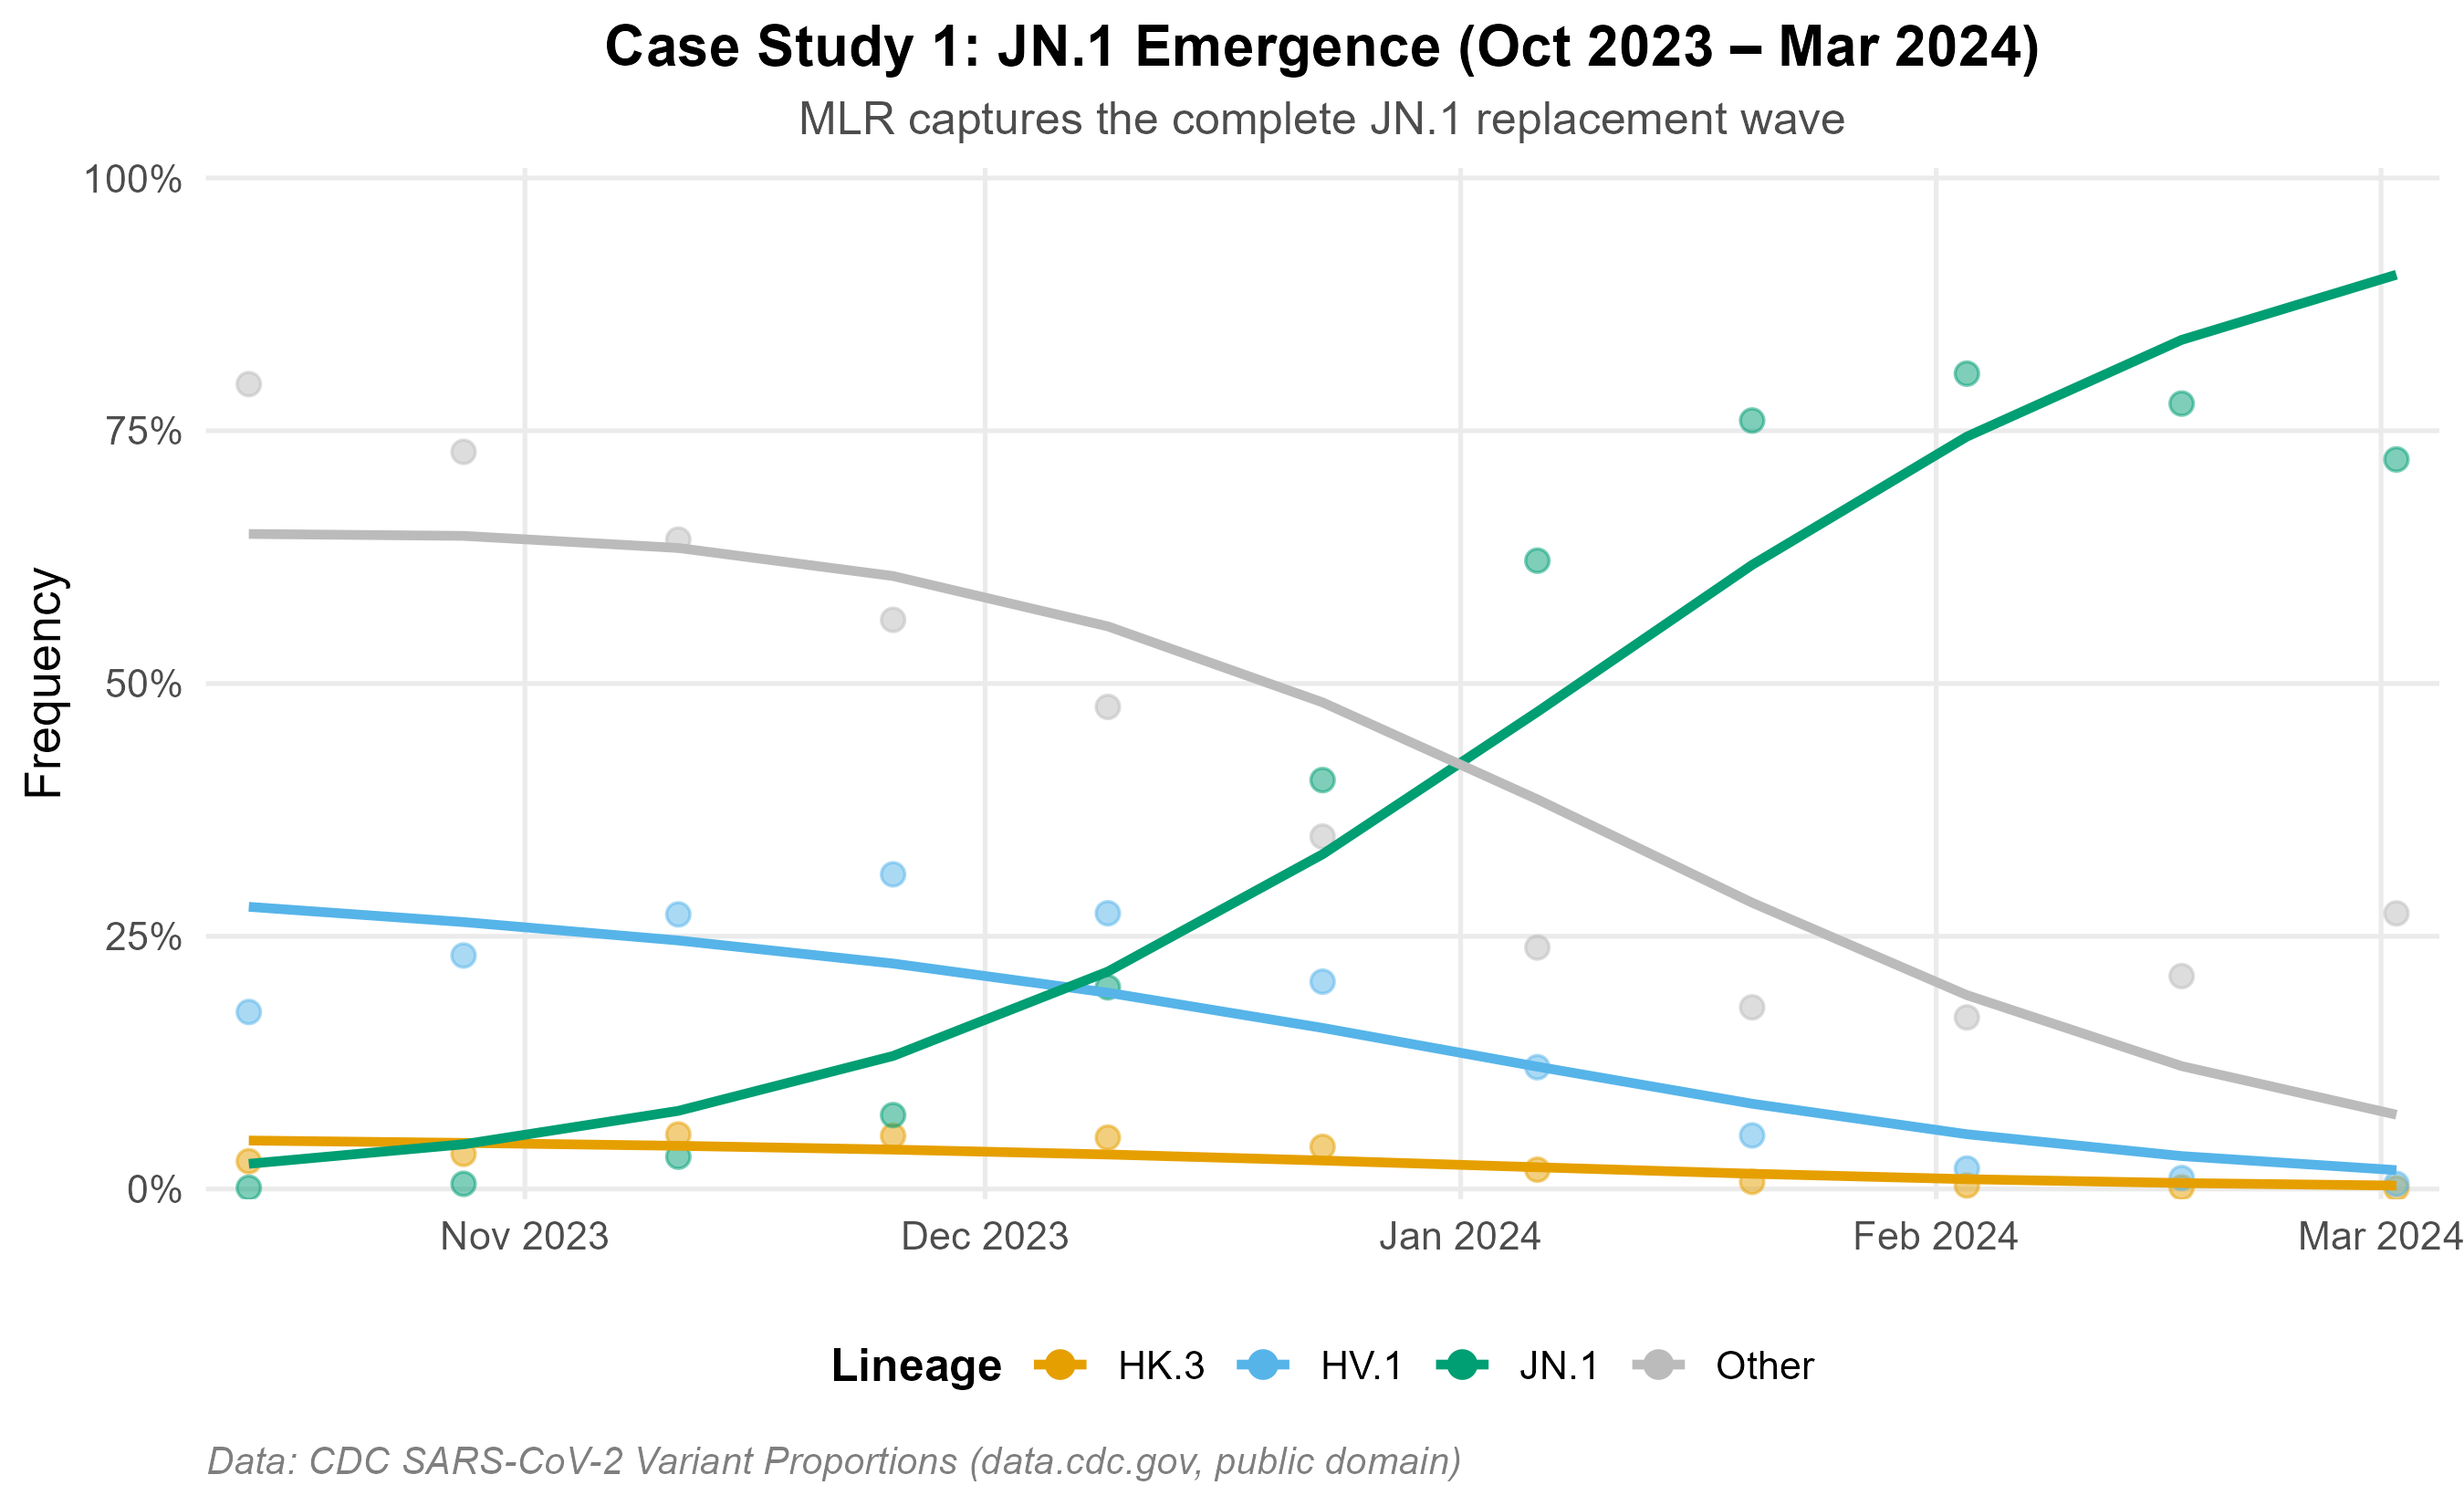
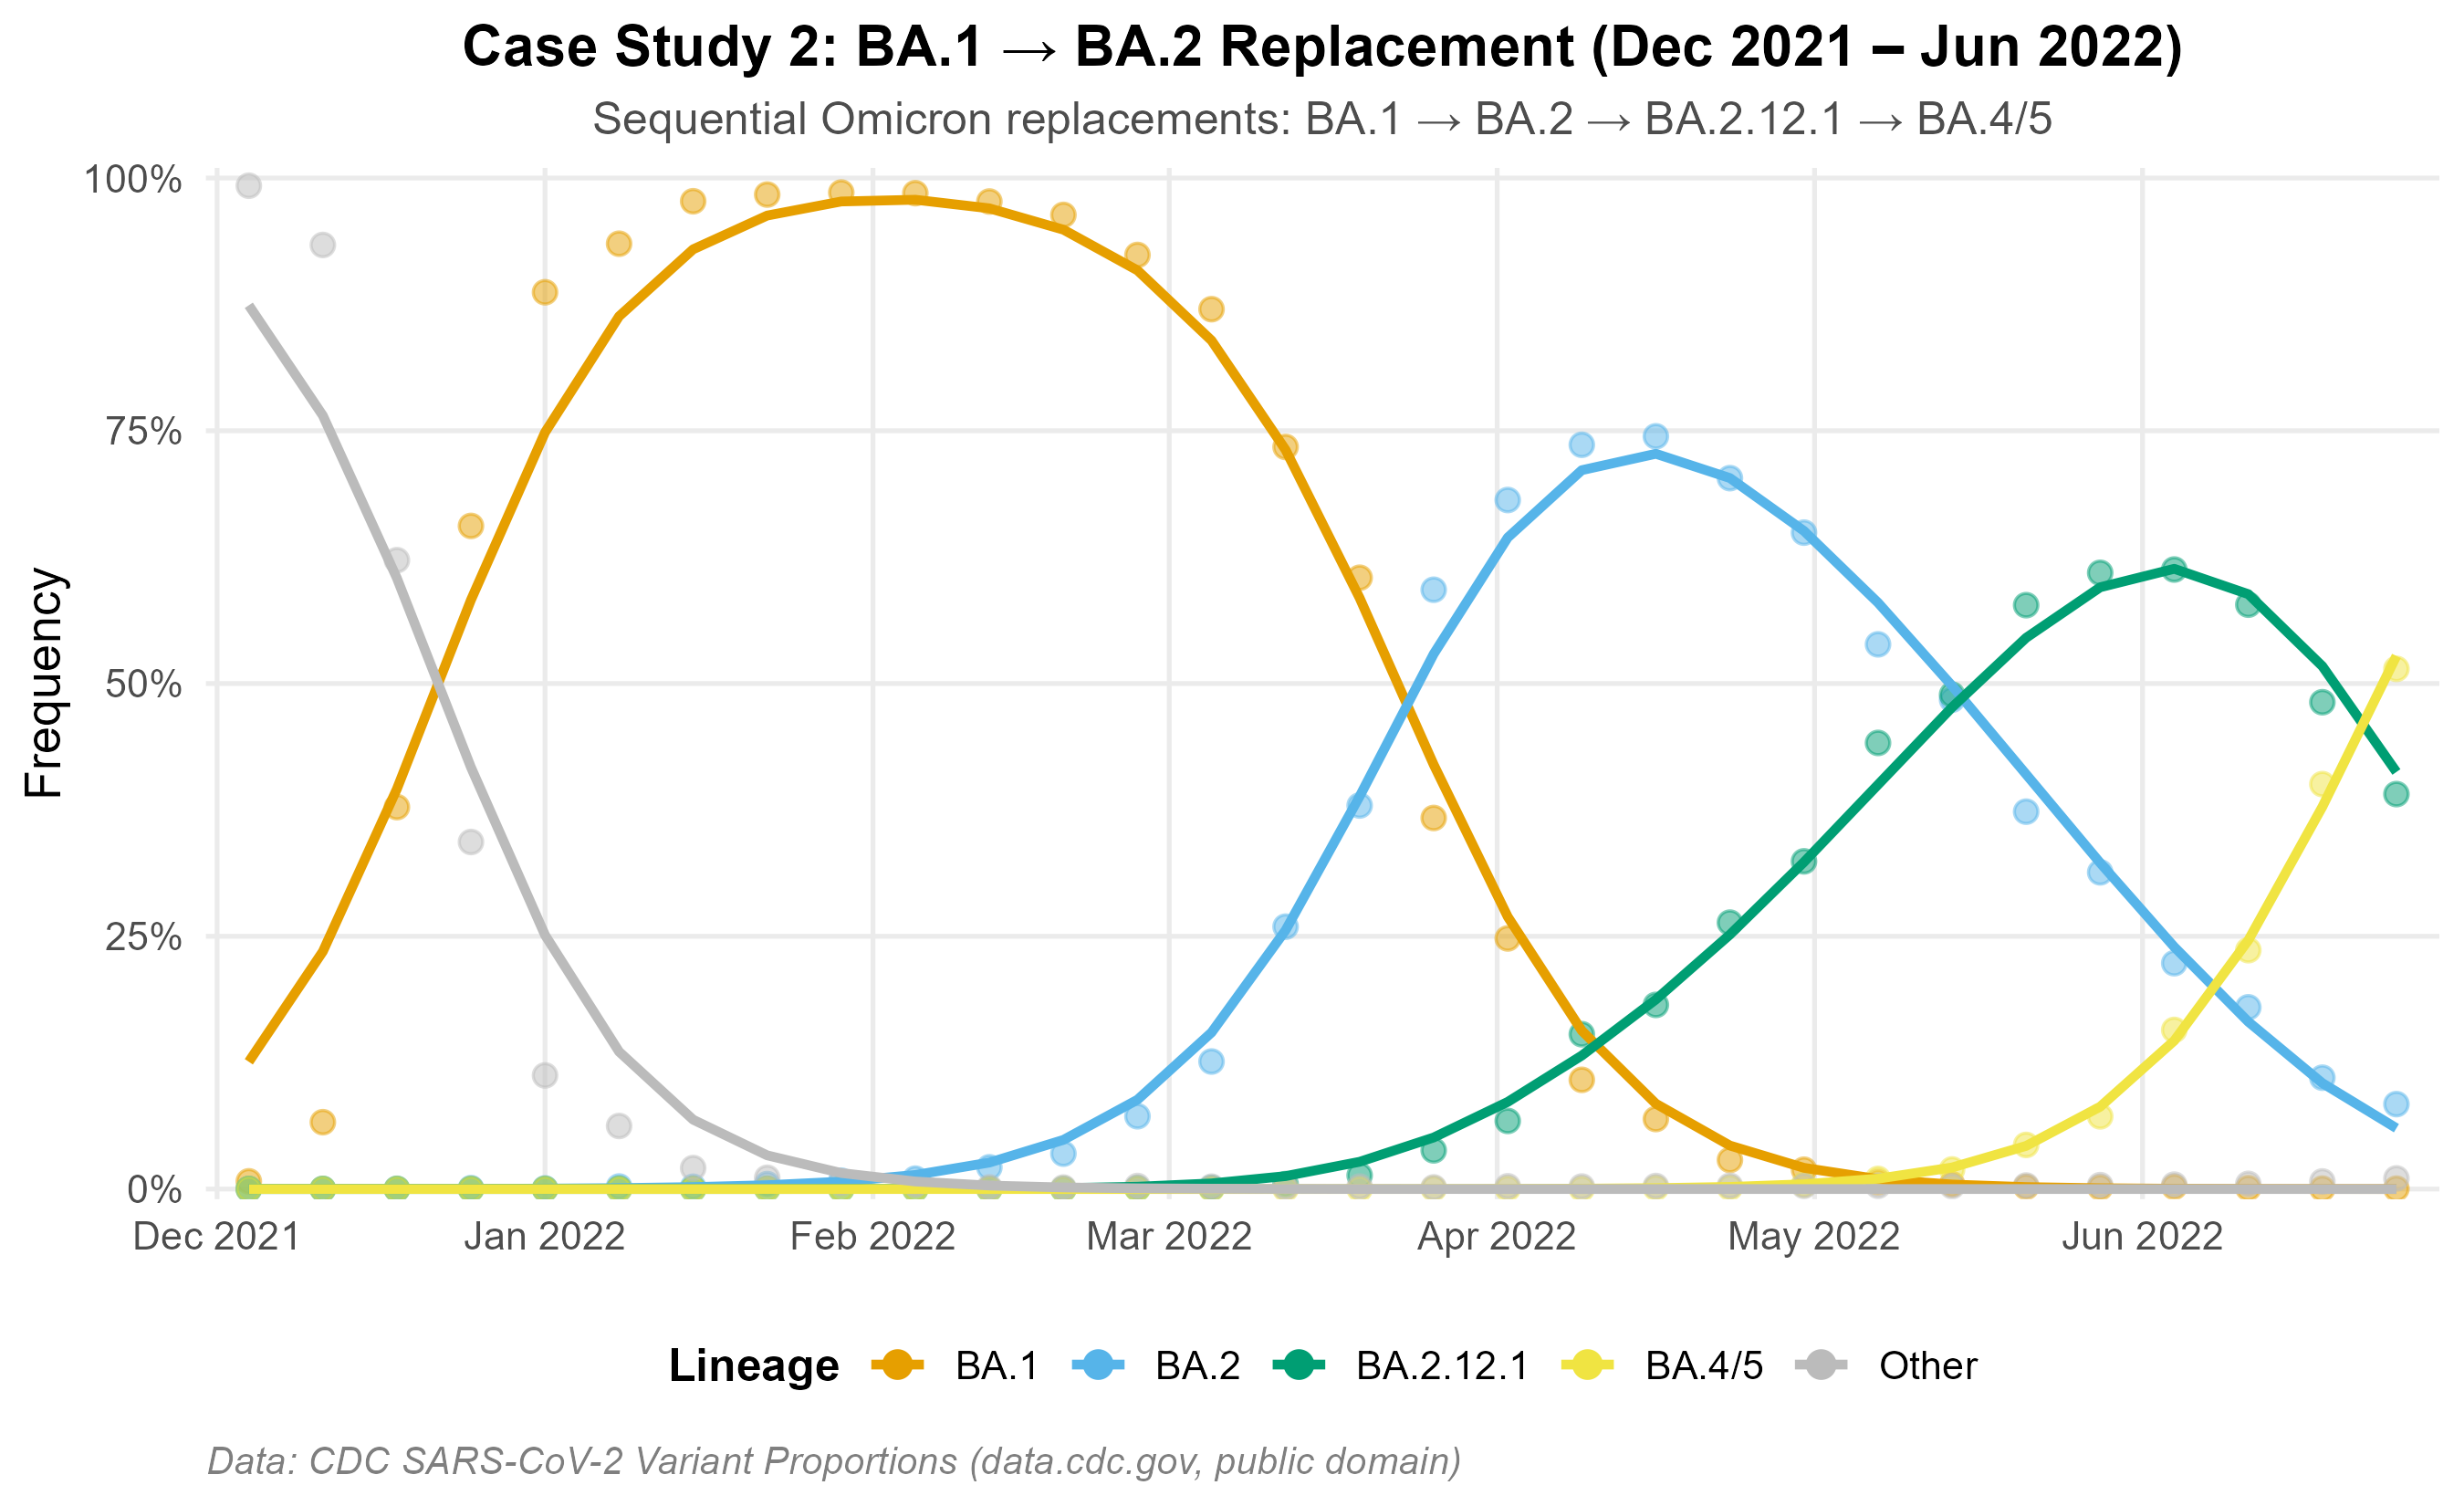
Figures below use real U.S. CDC surveillance data (data.cdc.gov/jr58-6ysp, public domain). Two independent epidemic waves illustrate model behavior across distinct replacement settings.
Data accessed 2026-03-28. Lineages below 5% peak frequency collapsed
to "Other." Reproducible scripts: data-raw/prepare_cdc_data.R and
data-raw/prepare_ba2_data.R.
Variant Replacement Dynamics
JN.1 emergence (Oct 2023 – Mar 2024): MLR recovers the observed replacement trajectory from <1% to >80%.
BA.1 → BA.2 period (Dec 2021 – Jun 2022): A well-characterized Omicron replacement wave with four sequential subvariant sweeps.
Growth Advantage Estimation
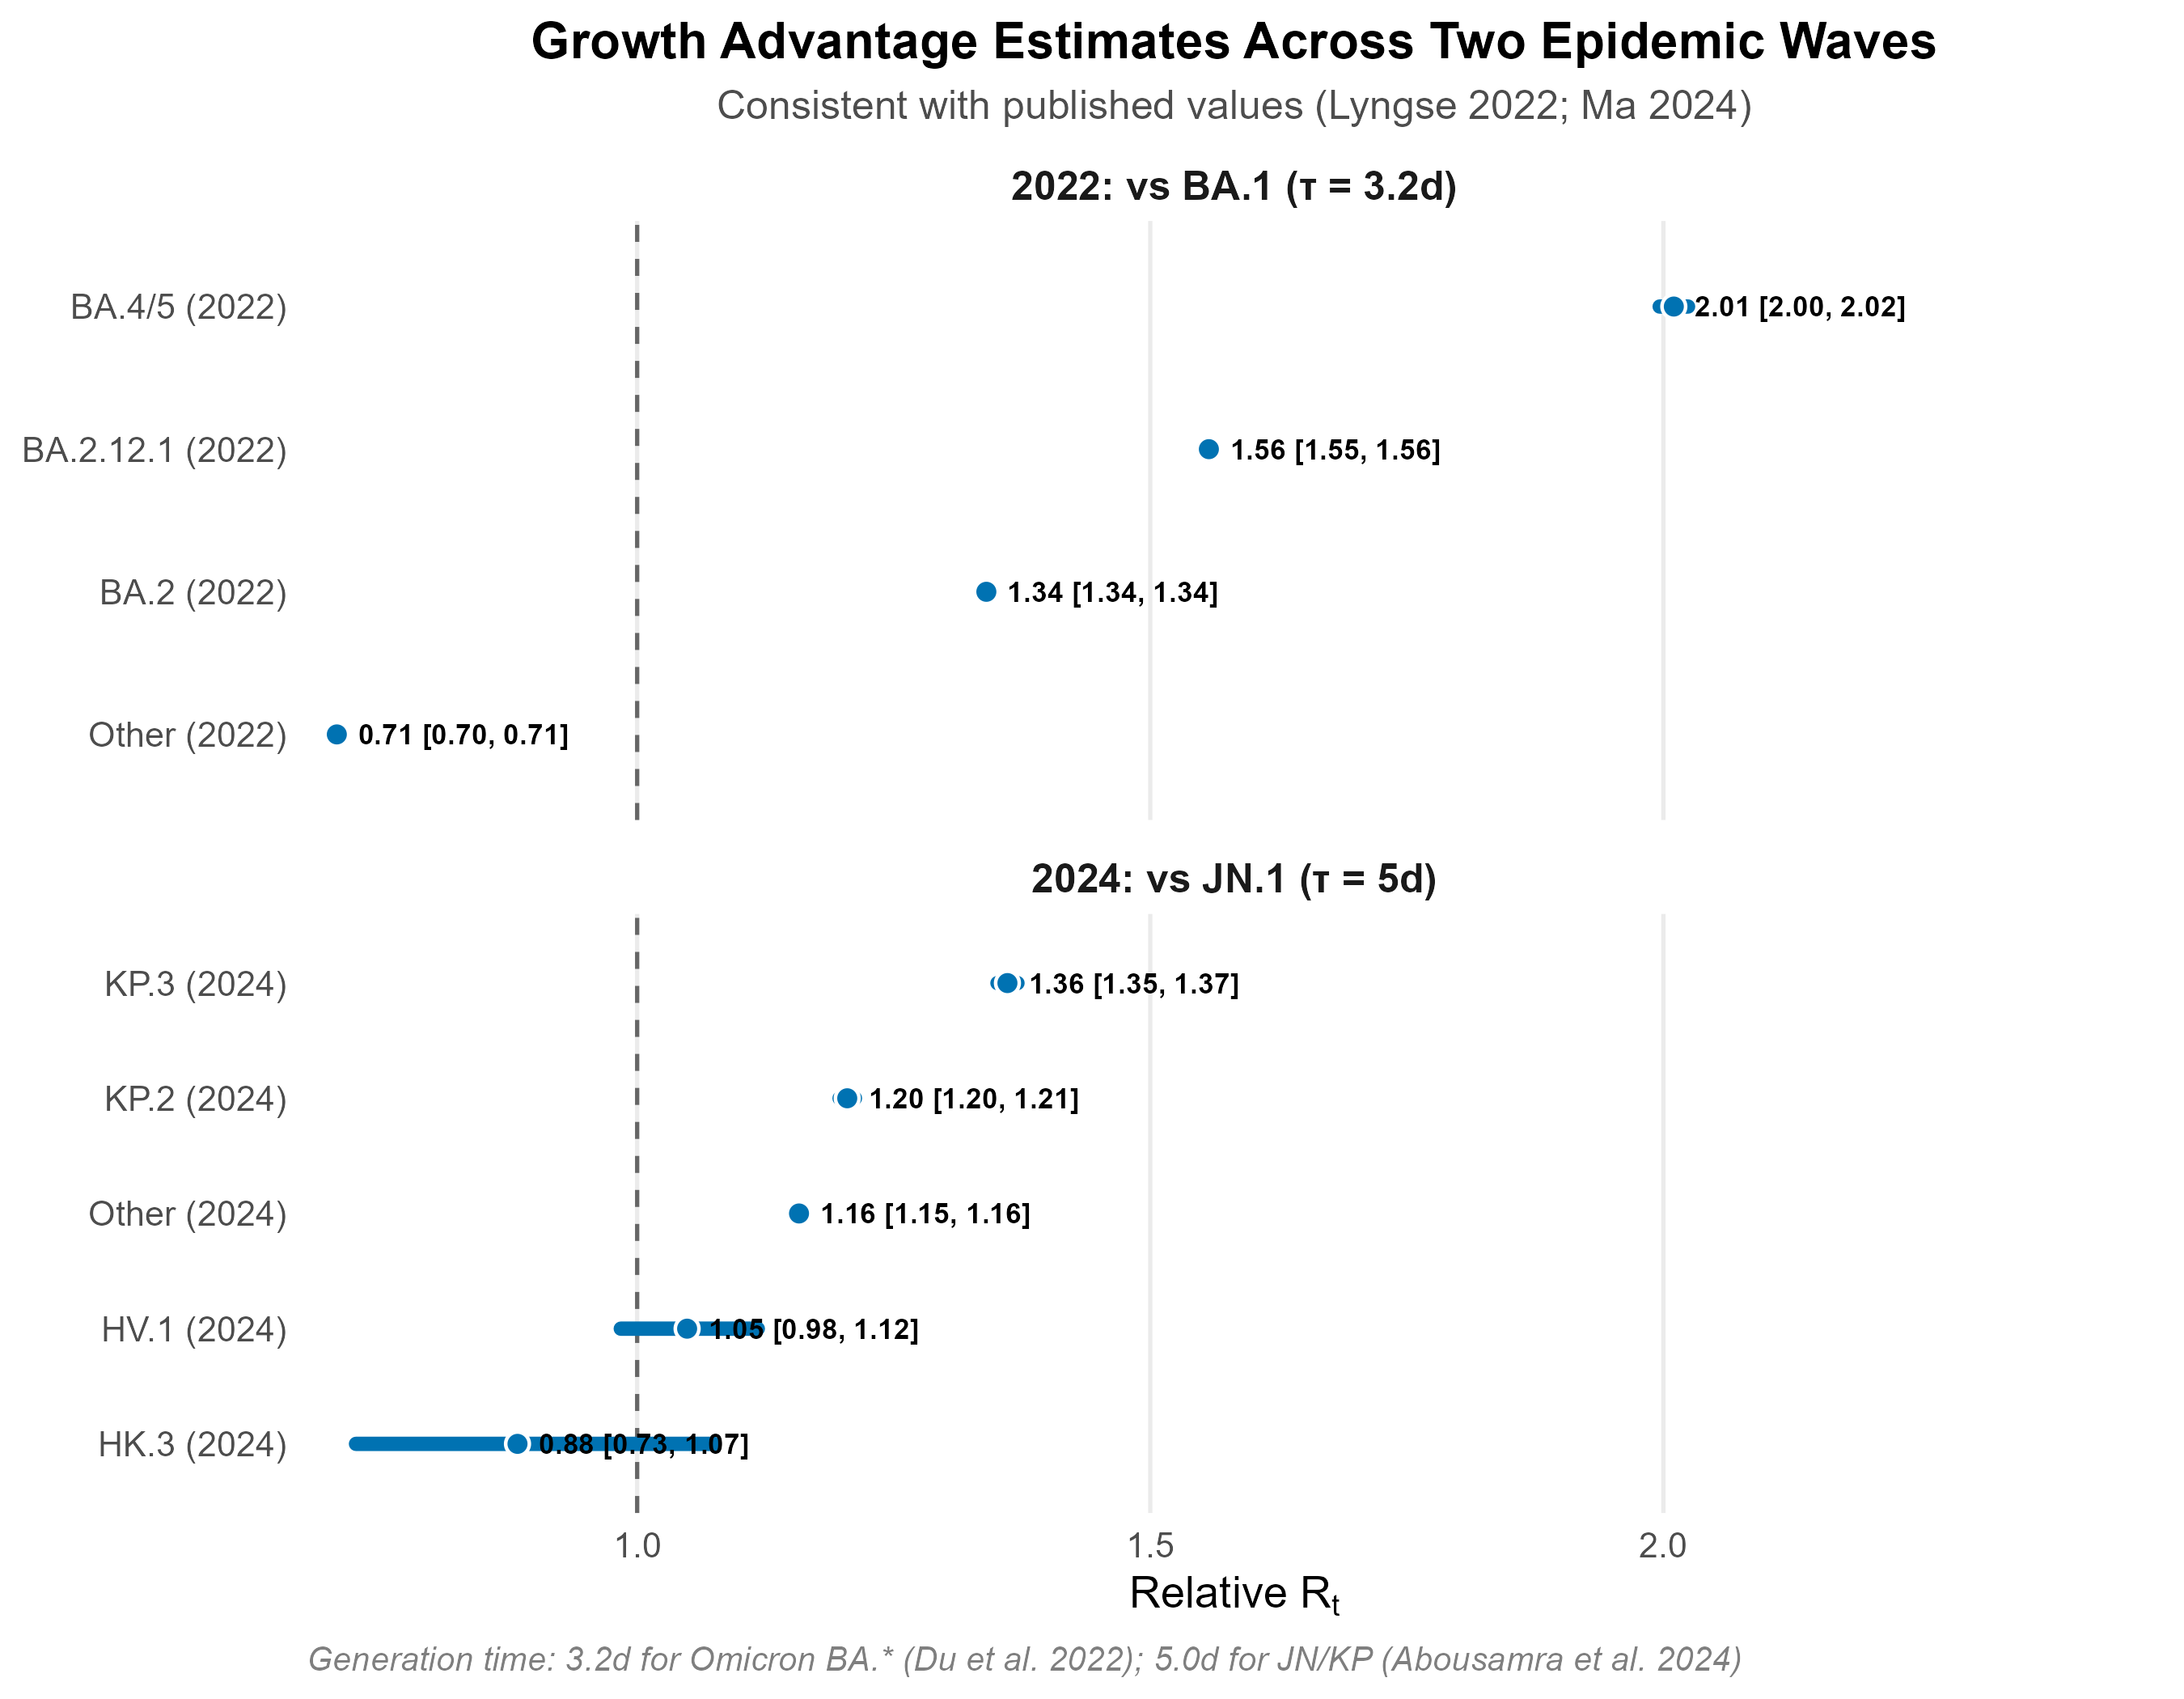
Relative Rt estimates are consistent with published values: BA.2 = 1.34× vs BA.1 (Lyngse et al. 2022, published 1.3–1.5×); KP.3 = 1.36× vs JN.1. Generation times: 3.2 days for Omicron BA.* subvariants (Du et al. 2022); 5.0 days for JN/KP lineages.
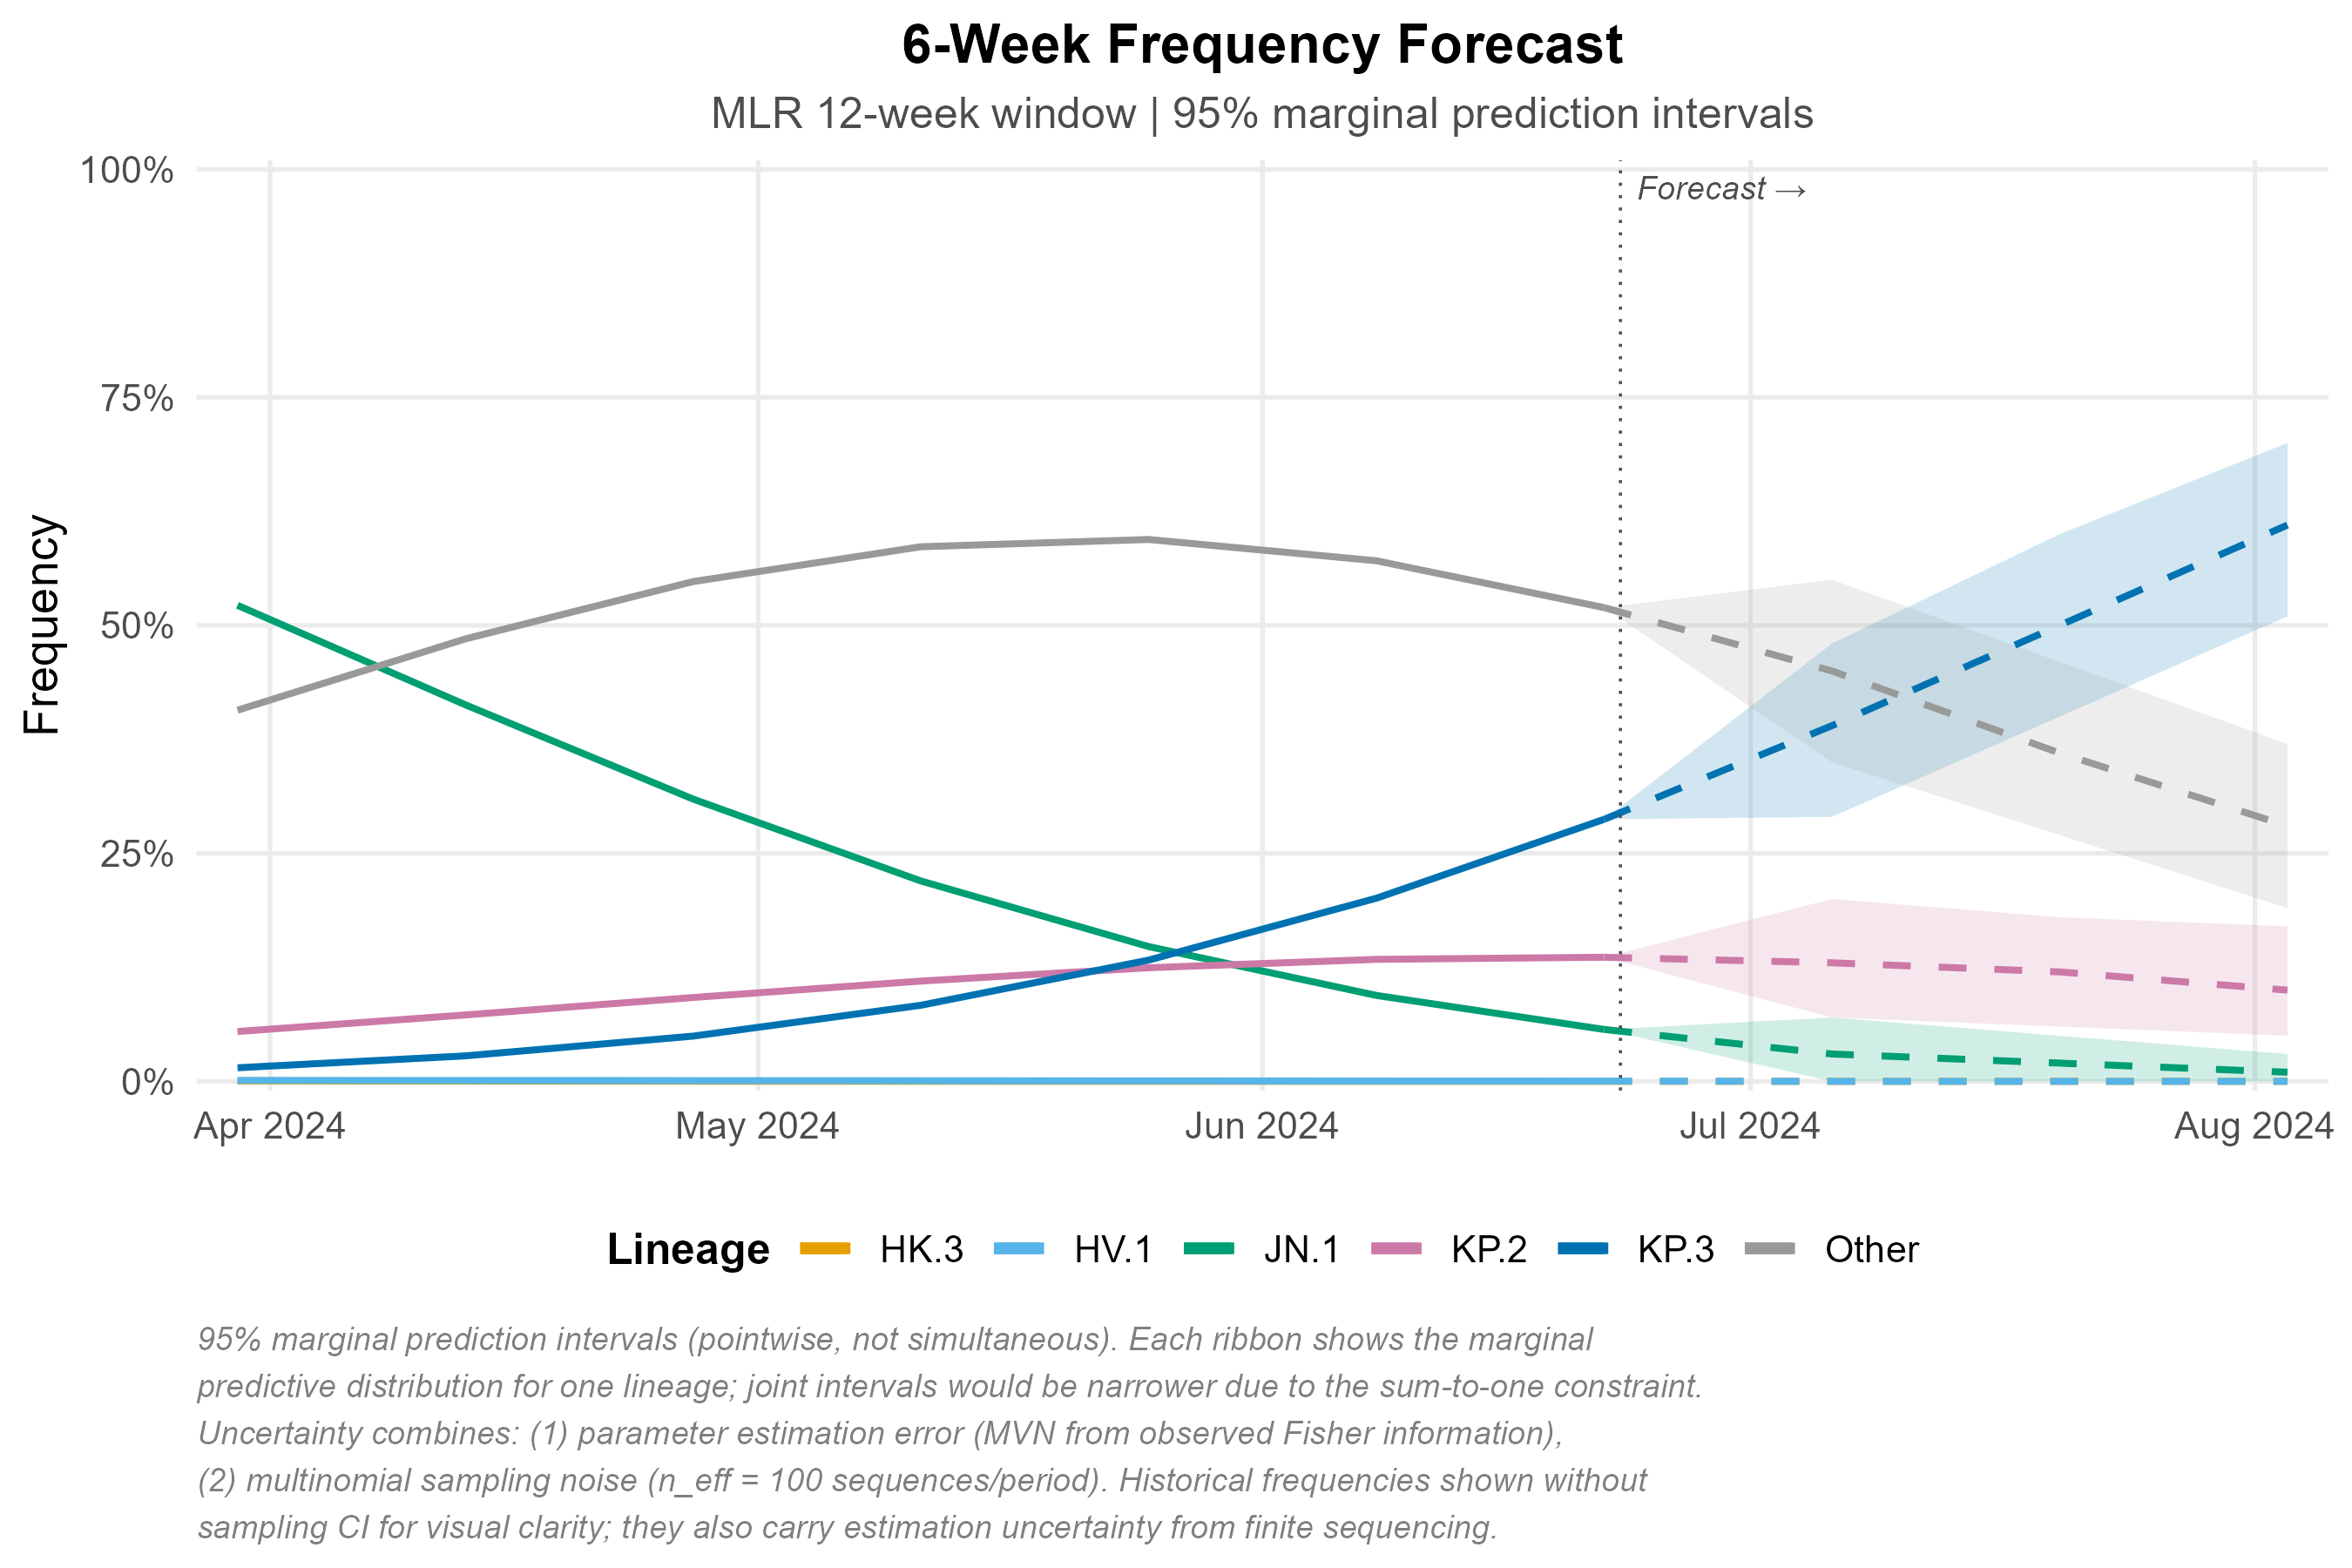
Frequency Forecast
Six-week projection with 95% marginal prediction intervals (pointwise, not simultaneous). Uncertainty reflects parameter estimation error (MVN from Fisher information) and multinomial sampling noise (n_eff = 100 sequences/period). See figure caption for full methodological notes.
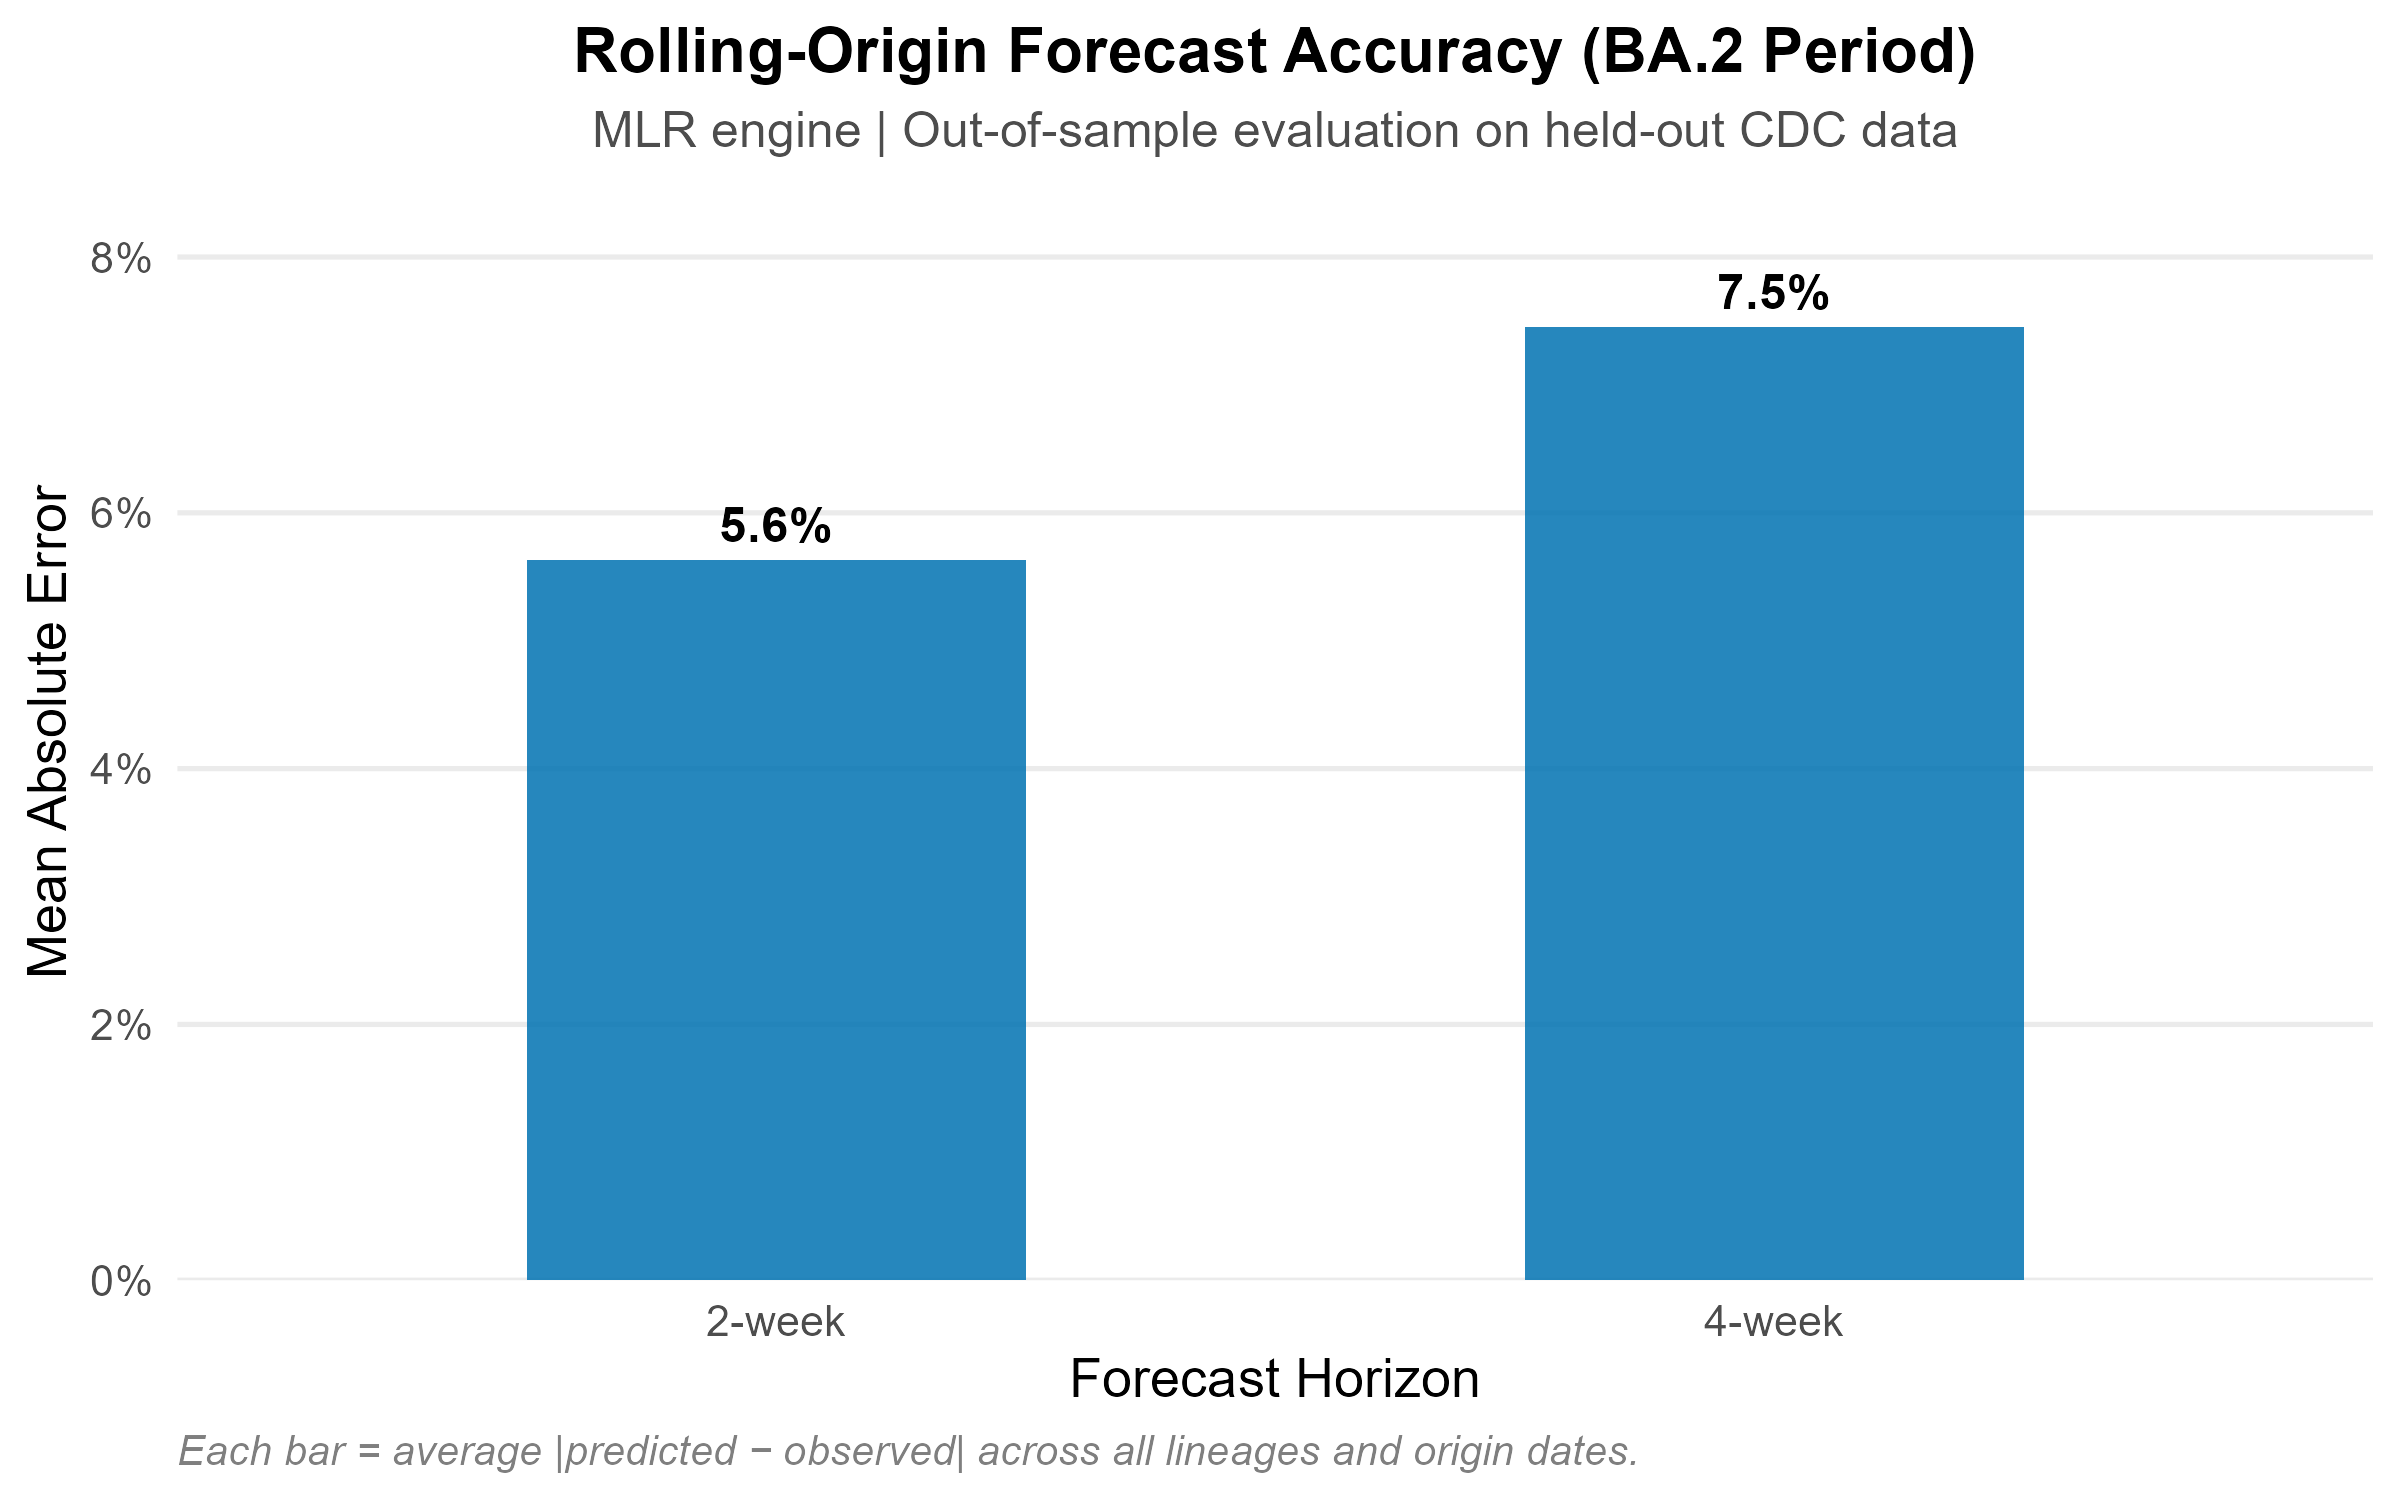
Forecast Accuracy
Rolling-origin out-of-sample evaluation on the BA.2 period: approximately 4% MAE at 2-week and 8% at 4-week horizon.
Features
Model fitting
fit_model()with engines"mlr","hier_mlr","piantham","fga","garw"(Bayesian engines require 'CmdStan')
Inference
- Growth advantage in four scales: growth rate, relative Rt, selection coefficient, doubling time
Forecasting
- Probabilistic frequency forecasts with parametric simulation and configurable sampling noise
Evaluation
- Rolling-origin backtesting via
backtest()with standardized scoring (MAE, RMSE, coverage, WIS) viascore_forecasts()
Surveillance utilities
summarize_emerging(): binomial GLM trend tests per lineagesequencing_power(): minimum sample size for detectioncollapse_lineages(),filter_sparse(): preprocessing
Visualization
autoplot()methods for fits, forecasts, and backtest summaries- Publication-quality output with colorblind-safe palettes
Interoperability
- broom-compatible:
tidy(),glance(),augment() as_lfq_data()generic for extensible data importread_lineage_counts()for CSV input
Supported pathogens
Any pathogen with variant/lineage-resolved sequencing count data: SARS-CoV-2, influenza, RSV, mpox, and others.
Citation
citation("lineagefreq")
A software paper and Zenodo DOI will be added upon publication.
License
MIT