mthapower
Sample Size and Power for Association Studies Involving Mitochondrial DNA Haplogroups
Calculate Sample Size and Power for
Association Studies Involving Mitochondrial DNA Haplogroups.
Based on formulae by Samuels et al. AJHG, 2006. 78(4):713-720.
mthapower 
Calculate sample size and power for association studies involving mitochondrial DNA haplogroups - Based on Samuels et al. AJHG, 2006. 78(4):713-720. DOI:10.1086/502682
Installation
- From CRAN:
install.packages("mthapower")
- From GitHub:
# install.packages("devtools")
devtools::install_github("aurora-mareviv/mthapower")
Shiny app
- Run in Shinyapps.io: mtDNA_power_calc
- Run locally from Gist:
# install.packages("shiny")
shiny::runGist('5895082')
Examples
Sample size estimation
- Determine the minimum number of cases (
Ncmin), required to detect: either a change fromp0(haplogroup frequency in controls) top1(haplogroup frequency in cases), or a given OR, with a predefined confidence interval, in a study withNhhaplogroups.
library(mthapower)
library(dplyr)
mydata <- mthacases(p0=0.445, Nh=11,
                    OR.cas.ctrl=c(2), power=80,
                    sig.level=0.05) # Baudouin study
mydata <- mthacases(p0=0.445, Nh=11,
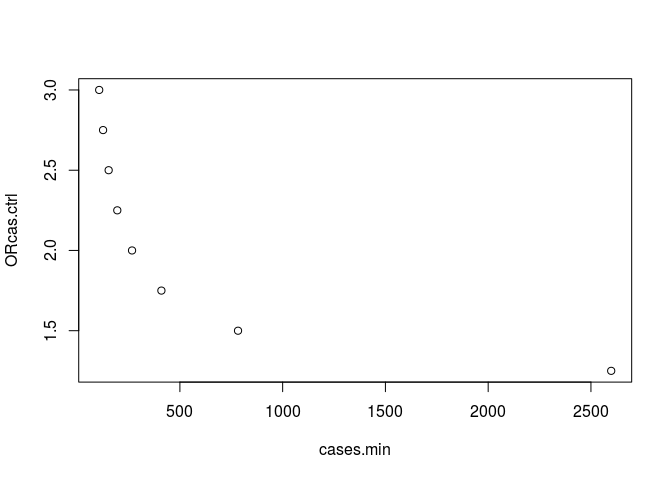
                    OR.cas.ctrl=c(1.25,1.5,1.75,2,2.25,2.5,2.75,3),
                    power=80, sig.level=0.05)
mydata <- mydata[c(2,6)]
mydata %>%
  knitr::kable()
| cases.min | ORcas.ctrl |
|---|---|
| 2598.580 | 1.25 |
| 782.882 | 1.50 |
| 410.041 | 1.75 |
| 267.193 | 2.00 |
| 195.428 | 2.25 |
| 153.394 | 2.50 |
| 126.216 | 2.75 |
| 107.388 | 3.00 |
plot(mydata)
Power estimation
- For a given study size, determine the minimum effect size that can be detected with the desired power and significance level, in a study with
Nhhaplogroups.
# Example 2a:
# library(mthapower)
pow <- mthapower(n.cases=203, p0=0.443, Nh=13, OR.cas.ctrl=2.33, sig.level=0.05)
pow %>%
  knitr::kable()
| Nh | ncases | p0 | p1 | OR.ctrl.cas | OR.cas.ctrl | power | sig.level |
|---|---|---|---|---|---|---|---|
| 13 | 203 | 0.443 | 0.65 | 0.429 | 2.33 | 82.759 | 0.05 |
# Example 2b:
# Create data frames
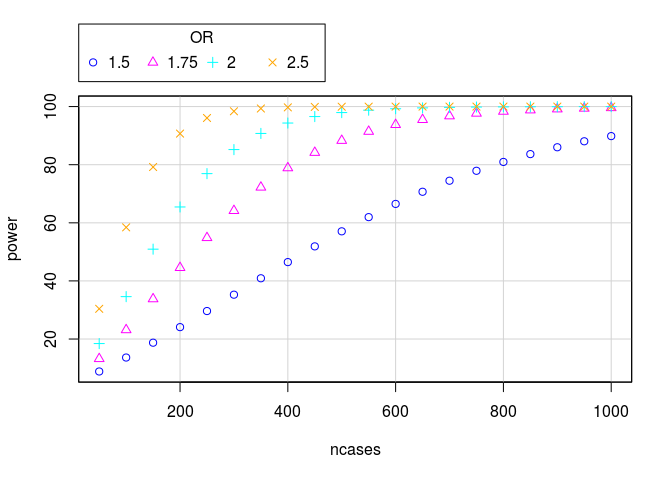
pow.H150 <- mthapower(n.cases=seq(50,1000,by=50), p0=0.433, Nh=11,
                      OR.cas.ctrl=1.5, sig.level=0.05)
pow.H175 <- mthapower(n.cases=seq(50,1000,by=50), p0=0.433, Nh=11,
                      OR.cas.ctrl=1.75, sig.level=0.05)
pow.H200 <- mthapower(n.cases=seq(50,1000,by=50), p0=0.433, Nh=11,
                      OR.cas.ctrl=2, sig.level=0.05)
pow.H250 <- mthapower(n.cases=seq(50,1000,by=50), p0=0.433, Nh=11,
                      OR.cas.ctrl=2.5, sig.level=0.05)

# Bind the three data frames:
bindata <- rbind(pow.H150,pow.H175,pow.H200,pow.H250)
# Adds column OR to binded data frame:
bindata$OR <- rep(factor(c(1.50,1.75,2,2.5)),
              times = c(nrow(pow.H150),
                        nrow(pow.H175),
                        nrow(pow.H200),
                        nrow(pow.H250)))
# Create plot:
# install.packages("car")
library(car)
scatterplot(power~ncases | OR, regLine=FALSE,
            smooth=FALSE,
            boxplots=FALSE,  by.groups=TRUE,
            data=bindata)