npdsim
Simulate Demand and Attributes for New Products
Simulate demand and attributes for ready to launch new products during their life cycle, or during their introduction and growth phases. You provide the number of products, attributes, time periods and/or other parameters and 'npdsim' can simulate for you the demand for each product during the considered time periods, and the attributes of each product. The simulation for the demand is based on the idea that each product has a shape and a level, where the level is the cumulative demand over the considered time periods, and the shape is the normalized demand across those time periods.
npdsim

The goal of npdsim is to simulate the demand for ready to launch new products over their life cycle, and to simulate their attributes. The generated data will help you test and compare your new product demand forecasting approaches.
The simulation of demand is based on the idea that each product has a demand level and a demand shape where level is the cumulative demand of the product over a specific number of time periods (the number of time periods is set by the user), and shape is the normalized demand over those periods. The attributes of each product are assumed to be linked to its shape and level.
Installation
You can install the development version of npdsim from GitHub with:
# install.packages("pak")
pak::pak("mohammedhichame/npdsim")
Example
This is a basic example which shows you how to simulate the demand and attributes for 200 products:
library(npdsim)

npd_data1 <- npd_data_sim(products_number=200,
                         periods_number=40,
                         shape_number=7,
                         level_number=30)

str(npd_data1)
#> 'data.frame':    8000 obs. of  13 variables:
#>  $ product_id : int  1 1 1 1 1 1 1 1 1 1 ...
#>  $ time       : num  1 2 3 4 5 6 7 8 9 10 ...
#>  $ demand     : num  8 18 22 27 32 43 50 56 72 78 ...
#>  $ attribute10: num  0.224 0.224 0.224 0.224 0.224 ...
#>  $ attribute8 : num  0.924 0.924 0.924 0.924 0.924 ...
#>  $ attribute1 : num  0.0923 0.0923 0.0923 0.0923 0.0923 ...
#>  $ attribute5 : num  0.393 0.393 0.393 0.393 0.393 ...
#>  $ attribute6 : num  0.74 0.74 0.74 0.74 0.74 ...
#>  $ attribute4 : num  0.594 0.594 0.594 0.594 0.594 ...
#>  $ attribute7 : num  0.618 0.618 0.618 0.618 0.618 ...
#>  $ attribute3 : num  0.282 0.282 0.282 0.282 0.282 ...
#>  $ attribute2 : num  0.368 0.368 0.368 0.368 0.368 ...
#>  $ attribute9 : num  0.335 0.335 0.335 0.335 0.335 ...
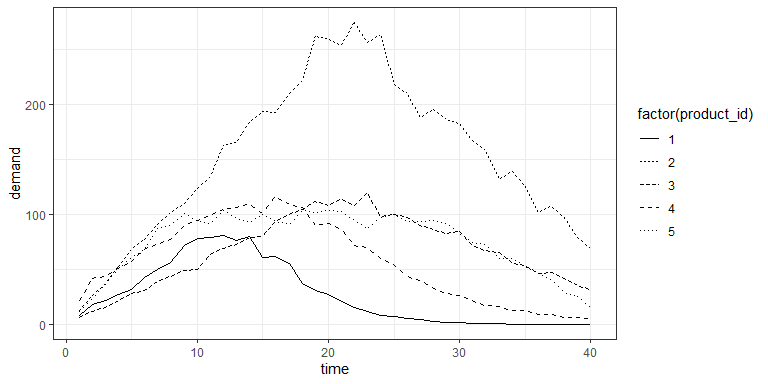
We show below, the plots of demand for the products with product_id=1,2,…,5:
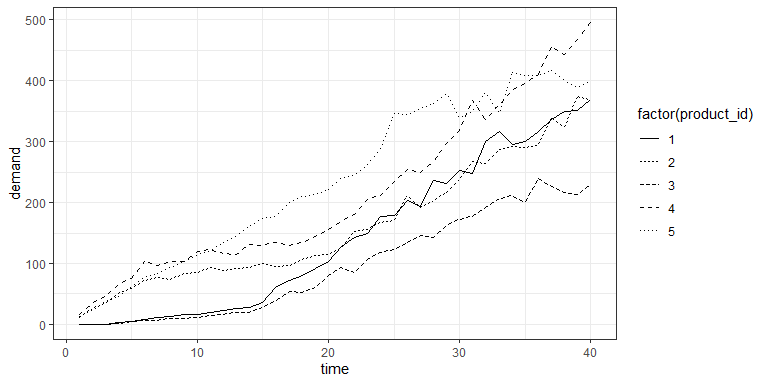
You can also generate the demand over only the introduction and growth phases of products. For example :
npd_data2 <- npd_data_sim(products_number=200,
                         periods_number=40,
                         shape_number=7,
                         level_number=30,
                         shape_type="intro & growth")
We can also only simulate the demand or attributes of products using the
functions demand_sim or attribute_sim_dep (or also
attribute_sim_ind).