potentiomap
Build Potentiometric Surfaces and Hydraulic-Gradient Arrows
Prepares groundwater-level observations from measured hydraulic
head or from depth-to-water and land-surface elevation, interpolates
potentiometric surfaces using thin-plate splines, inverse-distance
weighting, ordinary Kriging, universal Kriging, or user-supplied methods,
and creates raster, contour, diagnostic, support, and hydraulic-gradient
products for review and export. Functions retain method conditions and fit
diagnostics, validate explicit prediction tasks, inspect model-conditional
uncertainty and monitoring-network sensitivity, identify limited prediction
support, and check whether scaled hydraulic-gradient arrows remain within
finite raster support and end at lower modeled head. Raster processing uses methods from
'terra' (Hijmans 2025)
potentiomap


potentiomap turns groundwater-level observations into auditable
potentiometric-surface analyses, validation and uncertainty summaries,
monitoring-network diagnostics, contours, profiles, and GIS-ready
products.
Website · Examples · Function reference · Source · Issues · CRAN
What it provides
- preparation of measured head and positive depth-to-water observations;
- observation QA, monitoring-event selection, and explicit screen grouping;
- TPS, IDW, ordinary-kriging, universal-kriging, and custom interpolation;
- variograms, external drift, validation, nested tuning, and retained fits;
- prediction support, model-conditional uncertainty, method ensembles, and disagreement summaries;
- event change, vertical gradients, well influence, network thinning, and constrained candidate-site ranking;
- depth surfaces, transect profiles, and plot-ready cross-sections;
- contours that can be divided into supported, approximate, and unsupported sections using user-defined criteria;
- checked downgradient arrow symbols, open GIS styles, and technical reports.
Existing surface and contour workflows remain available with their ordinary return values. Rich result objects are optional when diagnostics, support, and manifests are needed.
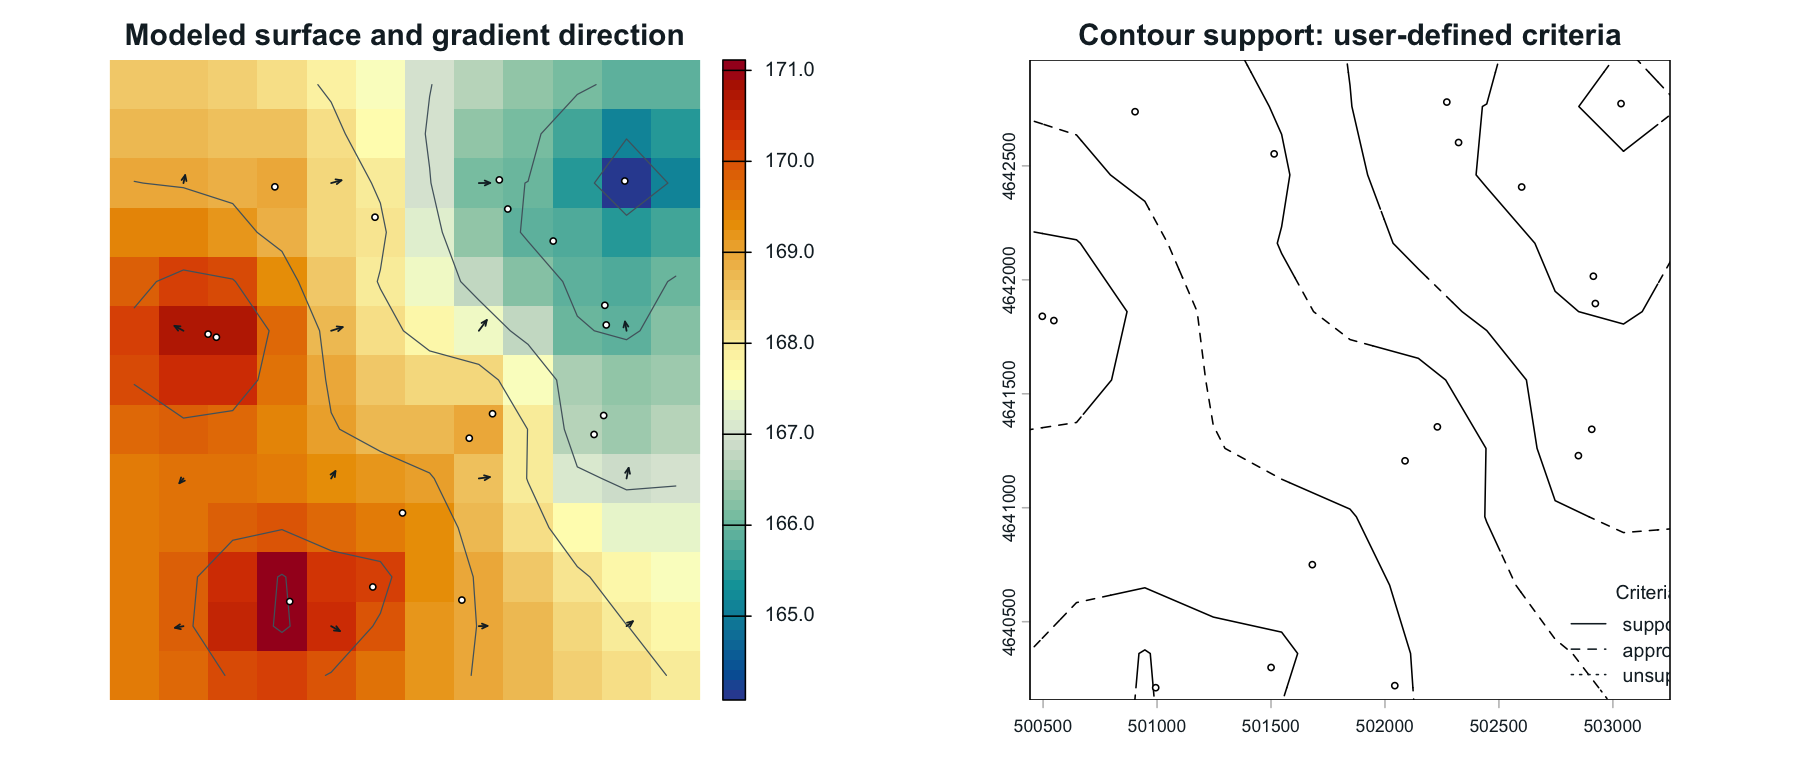
A reproducible overview from the installed synthetic data: a fitted surface (left) and checked model-gradient symbols with contours (right). Arrow length is a display convention, not groundwater velocity or a traced flow path.
Installation
Version note: CRAN currently serves
potentiomap0.1.0. This website documents 0.2.0 while that release is being reviewed. Use CRAN for the published release, or install the 0.2.0 source from GitHub when you need the features documented here.
install.packages("potentiomap")
install.packages("pak")
pak::pak("el-cordero/potentiomap")
Minimal workflow
library(potentiomap)

data("synthetic_wells")
points <- ps_make_points(
  synthetic_wells,
  x = "x", y = "y", value = "gw_elevation",
  name_col = "well_id", crs = "EPSG:26916"
)

surface <- ps_interpolate(points, methods = "TPS", grid_res = 100)$TPS
contours <- ps_contours(surface, interval = 1)
ps_quicklook(surface, contours = contours, points = points)
For complete, executable walkthroughs with printed outputs and maps, use the Examples section:
- Five-minute quick start
- Compare interpolation methods
- Diagnostics and prediction support
- Contours and hydraulic-gradient arrows
- Expanded 0.2.0 validation, uncertainty, monitoring-network, and profile articles
- Public USGS groundwater example
- Output gallery
Scientific scope
potentiomap is not a groundwater-flow or contaminant-transport model.
Interpolated surfaces depend on monitoring-network geometry, data
quality, aquifer selection, screened intervals, boundary conditions, and
method assumptions.
Prediction-support classes describe support available for a mapped result; they do not establish that a contour is correct and are not statistical confidence intervals. Hydraulic-gradient arrows point toward decreasing modeled head. Their length is a display convention, not velocity, travel time, or a traced groundwater path.
Cross-validation describes its recorded prediction task, not automatic area-wide map accuracy. Kriging variance is model conditional, method spread is not statistical uncertainty, modeled head change is not storage change, and network rankings are not globally optimal drilling plans.
Documentation and support
- Documentation
- Function reference
- Issue tracker
- Contributing guide
- Code of Conduct
- Support guide
- Security policy
Do not post confidential well coordinates, client data, private site identifiers, or restricted environmental data in public issues.
Run citation("potentiomap") for the package citation.