scatterbar
Scattered Stacked Bar Chart Plots
Provides a powerful and flexible tool for visualizing proportional data across spatially resolved contexts. By combining the concepts of scatter plots and stacked bar charts, 'scatterbar' allows users to create scattered bar chart plots, which effectively display the proportions of different categories at each (x, y) location. This visualization is particularly useful for applications where understanding the distribution of categories across spatial coordinates is essential. This package features automatic determination of optimal scaling factors based on data, customizable scaling and padding options for both x and y axes, flexibility to specify custom colors for each category, options to customize the legend title, and integration with 'ggplot2' for robust and high-quality visualizations. For more details, see Velazquez et al. (2024)
scatterbar
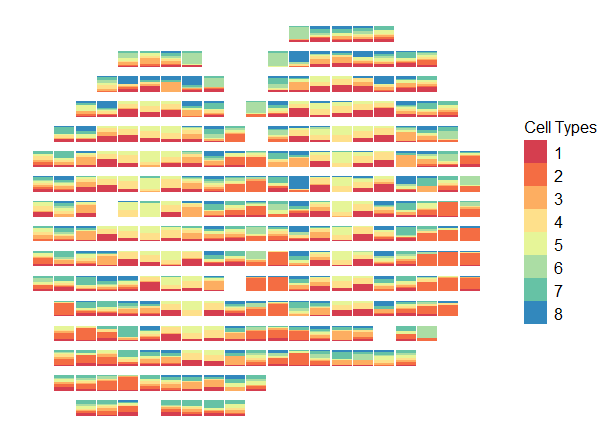
scatterbar is an open-source R package for displaying proportional data across spatially resolved contexts. This is the scatterbar R documentation
website. Questions, suggestions, or problems should be submitted as
GitHub issues.

Overview
By combining the concepts of scatter plots and stacked bar charts,
scatterbar allows users to visualize variations in proportional data
data and compare across different spatial locations.
Installation
To install scatterbarfrom GitHub, we recommend using remotes:
require(remotes)
remotes::install_github('JEFworks-Lab/scatterbar')
Tutorials
- Customizing Scatterbar
- Getting Started With Scatterbar
- Using Scatterbar With Visium Files
- Visualizing Multiple Datasets
- Flipping Scatterbar Oreintations
Citation
Our preprint describing scatterbar is available on bioRxiv: